
March 13, 2025
The Stock Market is a Market of Stocks
Brian Ransom, CFA, MBA, MS
Research Director
Signature Wealth Management Group
Duh, Brian! It’s purposefully redundant to call the stock market a market of stocks. But sometimes I wonder if people truly understand what the “stock market,” is. By definition, the stock market is a basket of assets ranging from ~$500,000 in market value all the way up to $3.4 trillion. As of the end of 2023, there were approximately 55,214 stocks that could be purchased throughout the world. On any given day, those stocks move in a wide variety of ways and often in opposite directions. Rarely do “most” stocks move in a similar direction.
And yet we have indices like the Dow and the S&P to give us a general mood in the market. Below is a screen shot of a CNBC.com graphic on March 10, 2025 at 12:45 pm EST. That particular day was a bad day for the market as you can see. The S&P 500 was down 2.3%, the Dow was down 1.3%, the Nasdaq was down almost 4%, and the Russell 2000 was down 1.7%. The VIX, an indexed measure of volatility, was up.
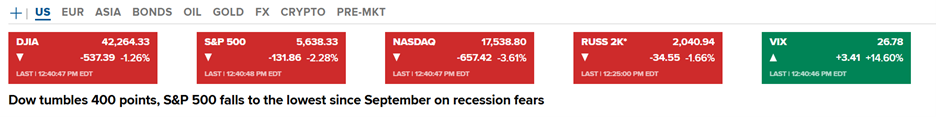
Source: CNBC.com on March 10, 2025.
But on that particular day, of the 499 stocks in the S&P 500, 230 were actually positive as of 1 pm EST. 150 had a positive return of 1% or greater on the day. Thus, in a day when CNBC is in a panic and the “market” is down 2.3%, almost half of the stocks in the S&P are actually positive on the day and 1/3rd are having a very good day of +1% returns (2).
The point is this: the headlines are reading “market bad.” But that’s not actually the case when you look under the hood.
Of the 230 positive stocks, 201 pay a dividend. 128 of the 230 positive stocks have Price/Earnings multiples less than the S&P 500 median of 25x (2). There’s a clear theme here. Value stocks have worked in 2025 whereas the growth stocks that have dominated the market for the last 2 years, have not. But the growth stocks have become such an outsized portion of the market-cap weighted index that they seem to drag everything else down with it. Dividend-paying stocks (orange below) are actually up 4% in 2025 where as growth (pink) and tech (red) are driving the “market” down (blue) as of March 10.
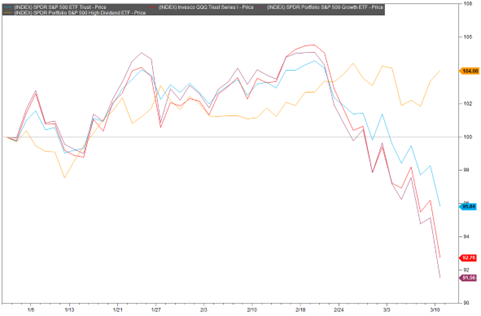
Source: Factset Database. SPY (S&P 500, blue), QQQ (Nasdaq, red), SPYG (S&P 500 Growth, purple), and SPYD (S&P 500 high dividend, orange). Data retrieved March 10, 2025.
In fact, diversified investors are probably doing just fine in 2025. Gold (orange), treasuries (purple), and bonds (red) are all positive on the year as of March 13. I would bet that many diversified investors are having trouble reconciling the panic they see on the TV with the performance in their portfolio.
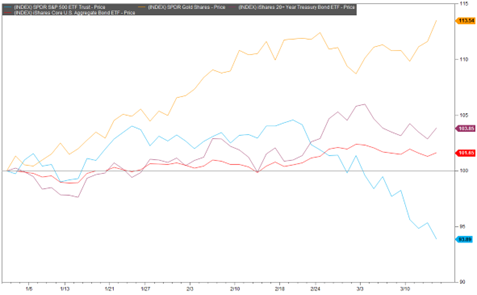
Source: Factset Database. SPY (S&P 500, blue), GLD (Gold, orange), TLT (20+ year treasury index, purple), AGG (US Aggregate bond index, red). Data retrieved on March 13, 2025.
There’s two main points to make here. First, diversification is important so that your portfolio can produce returns in a wide variety of environments. Especially if you’re in your distribution phase of your retirement lifecycle. And if you’re in the contribution phase of your retirement lifecycle, then congratulations, the growth stocks you want to own are now cheaper.
Second, the S&P 500 is no longer diversified. Passive investing has worked wonders over the last two decades. But lately, the S&P 500 has been behaving more and more like the growth stocks that sit at the top of its allocation stack. This is one reason why we don’t allow our portfolios to skew based on market cap. But that is a risk many investors are conveniently ignoring or don’t realize is embedded in their portfolios.
Sources:
- com. Top chiron on March 10, 2025.
- Factset Research Systems. (N.D.). S&P 500 (screened data). Retrieved March 10, 2025, from Factset Database at 1 pm EST.
- Factset Research Systems. (N.D.). SPY, SPYD, SPYG, and QQQ (interactive charts). Retrieved March 10, 2025, from Factset Database.
- Factset Research Systems. (N.D.). SPY, GLD, TLT, and AGG (interactive charts). Retrieved March 13, 2025, from Factset Database.
This material is for informational or educational purposes only.
Investing involves risk including the potential loss of principal. No investment strategy can guarantee a profit or protect against loss in periods of declining values.
Diversification does not guarantee profit nor is it guaranteed to protect assets.
The Standard & Poor’s 500 (S&P 500) is an unmanaged group of securities considered to be representative of the stock market in general.
The Dow Jones Industrial Average is a price-weighted average of 30 significant stocks traded on the New York Stock Exchange and the NASDAQ. The DJIA was invented by Charles Dow back in 1896.
The Nasdaq Composite is an index of the common stocks and similar securities listed on the NASDAQ stock market and is considered a broad indicator of the performance of stocks of technology companies and growth companies.
The Russell 2000® Index measures the performance of the small-cap segment of the US equity universe. The Russell 2000 Index is a subset of the Russell 3000® Index representing approximately 7% of the total market capitalization of that index, as of the most recent reconstitution. It includes approximately 2,000 of the smallest securities based on a combination of their market cap and current index membership.
The price-to-earnings (P/E) ratio measures a company’s share price relative to its earnings per share (EPS).
Fixed income investments are subject to various risks including changes in interest rates, credit quality, inflation risk, market valuations, prepayments, corporate events, tax ramifications and other factors.