October 1, 2024
Market Update: September 25th, 2024
Welcome to the Monthly Market Update from Signature Wealth Management. I’m Brian Ransom, Research Director from Signature Wealth and here’s what happened in the market this month.
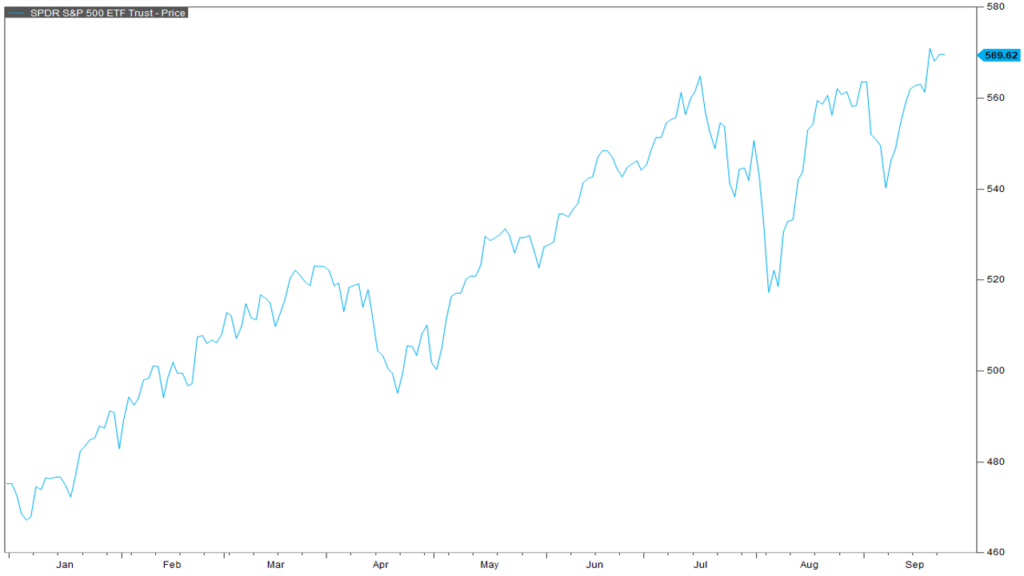
Well folks, we are finally here! We got our first set of rate cuts this month. The Federal Reserve cut their benchmark rate by 50 basis points or half a percent. The larger 50 basis point cut came as a positive surprise to the market which rallied on the news of a bit of extra monetary relief.

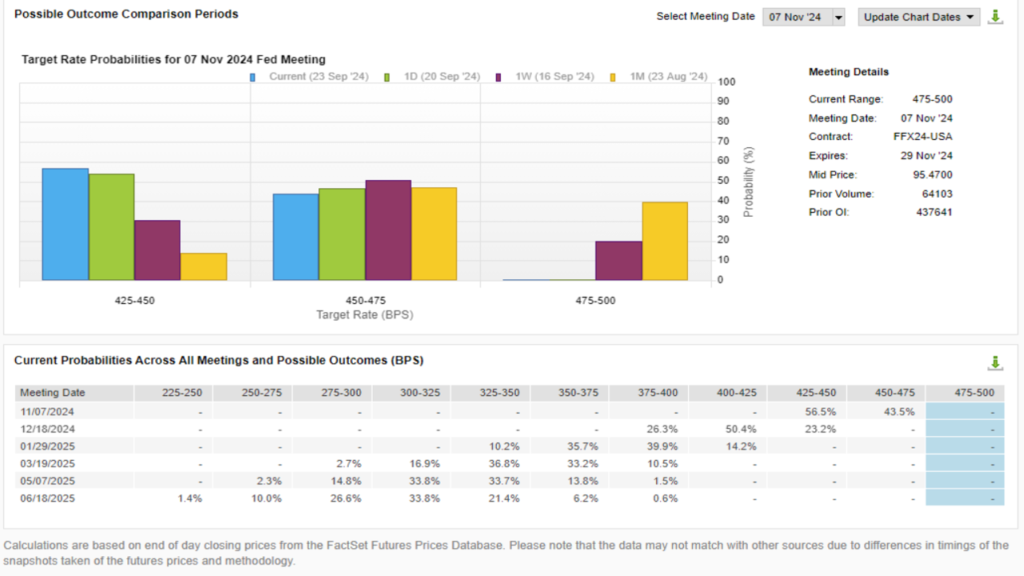
Looking ahead, the market now expects a second 50 basis point cut for the November 7 meeting later this year. Looking even further ahead, the market is anticipating rates to fall as low as 3% by June of 2025.

The economy typically reacts in unexpected ways when rates change, which can sometimes lead to volatility in the market. Usually, when rates are cut, that results in what’s called a J-Curve of intended consequences on the economy. Usually, rate cuts have an immediate negative effect on the economy as rates on savings accounts, bonds, and CD’s fall causing investor sentiment to fall and reducing consumer spending. Essentially, savers have spent a decade earning 0% on their savings accounts and suddenly had an additional form of cash flow beginning in 2023. Now, that cash flow is being reduced and that should have an immediate negative effect on the economy. However, as rates continue to fall, so too do borrowing rates for both consumers and businesses. This translates into additional capital investments, more hiring, and wage increases. All of which lead to higher consumer confidence and spending. But this effect can take time.
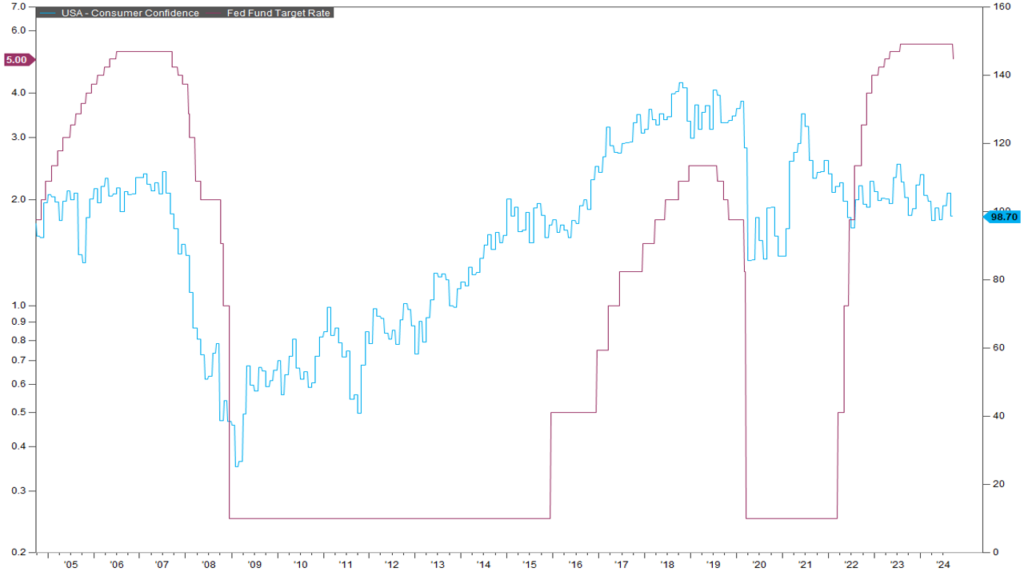
You can clearly see this dynamic by overlaying the Fed Funds rate in purple with the consumer confidence index in blue. The first set of rate cuts in 2008 and 2020 coincided with a commiserate drop in consumer confidence. It wasn’t until several months later that consumer confidence started to return once the rate cuts were felt in the broader economy.

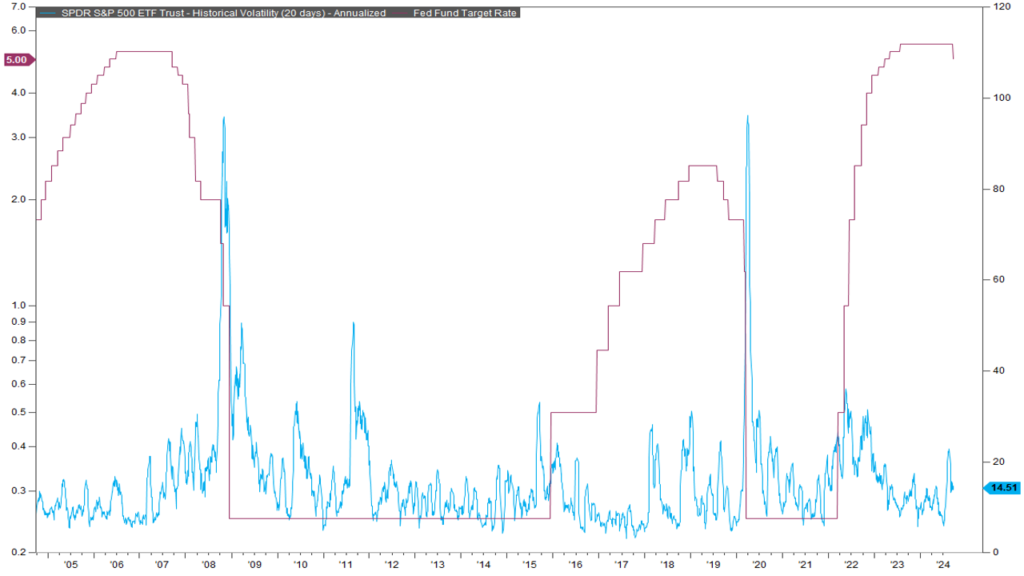
For investors, changes in interest rates typically result in increased volatility in the stock market indicated here in blue. Rate cuts in 2008 and 2020 resulted in large spikes in volatility. But also rate increases in 2015 and 2022 resulted in slight increases in volatility as well. We are still very early in the rate cutting process so we’ll see if we get increased volatility associated with the 2024/25 rate cuts.

Thanks for joining for the monthly market update! We have a new podcast called “Business Tales.” You can find Business Tales on all your favorite podcasting apps. Also, our website is full of economic, financial planning, and market content. For those looking for more information please visit our website at signaturewmg.com. And don’t forget to like and subscribe.
- FactSet Research Systems. (n.d.). S&P 500 (Interactive Charts). Retrieved September 24, 2024, from FactSet Database.
- FactSet Research Systems. (n.d.). Policy Rate Tracking (Markets). Retrieved September 24, 2024, from FactSet Database.
- FactSet Research Systems. (n.d.). Consumer Confidence & Fed Funds Target Rate (interactive charts). Retrieved September 24, 2024, from FactSet Database.
- FactSet Research Systems. (n.d.). S&P 500 underlying volatility & Fed Funds Target Rate (interactive charts). Retrieved September 24, 2024, from FactSet Database
Signature Wealth Management Group is registered as an investment adviser with the SEC. Signature Wealth only transacts business in states where it is properly registered, or is excluded or exempted from registration requirements.
Information presented is believed to be factual and up-to-date, but we do not guarantee its accuracy and it should not be regarded as a complete analysis of the subjects discussed. All expressions of opinion reflect the judgment of the author as of the date of publication and are subject to change.
Information contained herein does not involve the rendering of personalized investment advice, but is limited to the dissemination of general information.
The Standard & Poor’s 500 (S&P 500) is an unmanaged group of securities considered to be representative of the stock market in general.
The federal funds rate refers to the target interest rate set by the Federal Open Market Committee (FOMC). This target is the rate at which commercial banks borrow and lend their excess reserves to each other overnight.
Always consult an attorney or tax professional regarding your specific legal or tax situation.
Past performance does not guarantee future results. Consult your financial professional before making any investment decision.
Forward-looking statements are not guarantees, and they involve risks, uncertainties and assumptions. The use of words such as “will”, “may”, “could”, “should”, and “would”, as well as any other statement that necessarily depends on future events, are intended to identify forward-looking statements.
Information is not an offer to buy or sell, or a solicitation of any offer to buy or sell the securities mentioned herein.
The S&P U.S. Style Indices measure the performance of U.S. equities fully or partially categorized as either growth or value stocks, as determined by Style Scores for each security. The Style series is weighted by float-adjusted market capitalization (FMC), and the Pure Style index series is weighted by Style Score subject to the rules described in Index Construction.
All information presented prior to an index’s Launch Date is hypothetical (back-tested), not actual performance. The Index returns shown do not represent the results of actual trading of investable assets/securities. S&P Dow Jones Indices LLC maintains the Index and calculates the Index levels and performance shown or discussed, but does not manage actual assets. Please refer to the methodology paper for the Index, available at www.spdji.com for more details about the index, including the manner in which it is rebalanced, the timing of such rebalancing, criteria for additions and deletions, as well as all index calculations.
The Consumer Price Index (CPI) is a measure that examines the weighted average of prices of a basket of consumer goods and services, such as transportation, food, and medical care. It is calculated by taking price changes for each item in the predetermined basket of goods and averaging them. Changes in the CPI are used to assess price changes associated with the cost of living.
