
November 5, 2024
Market Update: October 22, 2024
Welcome to the Monthly Market Update from Signature Wealth Management. I’m Brian Ransom, Research Director from Signature Wealth and here’s what happened in the market this month.
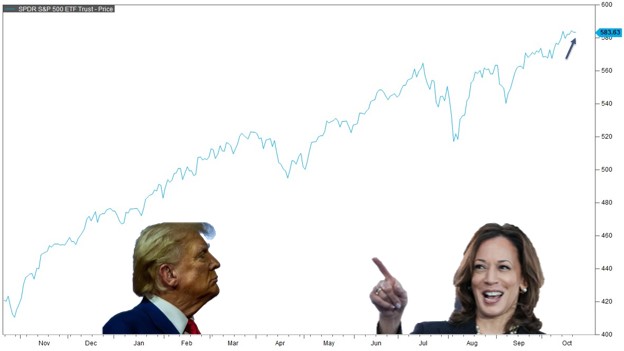
The market just continues to march higher despite war in the Middle East, slowing consumer spending, and a really tight race between these two.
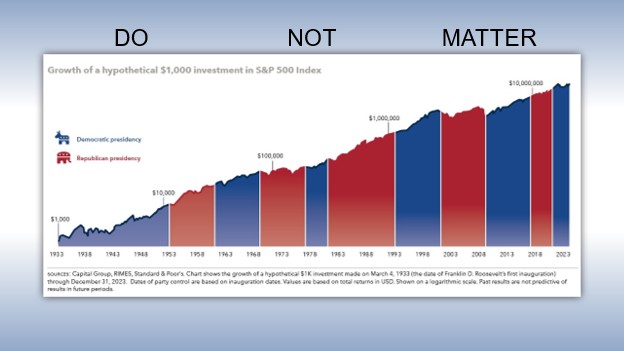
For those wondering why I haven’t commented on the upcoming election, it’s because the results of the election do not matter to the long-term trajectory of the markets. There is no statistically significant difference between returns in a Republican presidency, a Democratic presidency, and a split government. Don’t let anyone tell you otherwise.
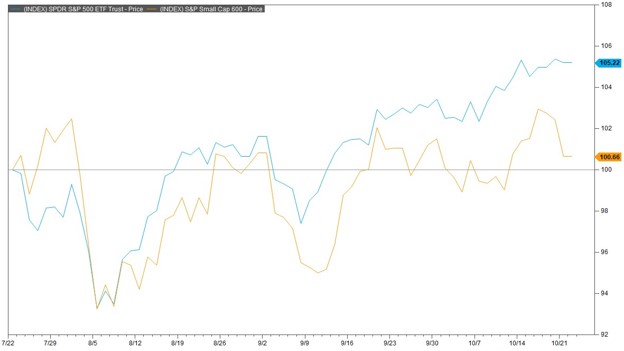
Going right back to things that do matter to the markets, we have seen a very strong “broadening” of market participation over the last three months with the equal weight index in purple outperforming the market cap-weighted S&P 500 in blue. More stock return participation is a sign of a healthy market. Although we haven’t yet seen participation out of the small caps just yet, shown here in orange. A small cap rally would indicate that monetary easing is having a tangible impact on the broader economy.
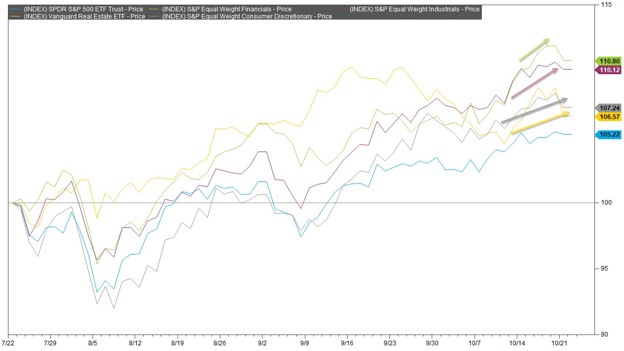
What we have seen is strong participation from Financials in green, industrials in purple, consumer discretionary in gray, and real estate in yellow. All of which are highly cyclical businesses and all of which are sensitive to interest rates. Thus, lower interest rates is having an impact on the larger cyclical businesses, we just haven’t seen that trickle down into the small caps yet.
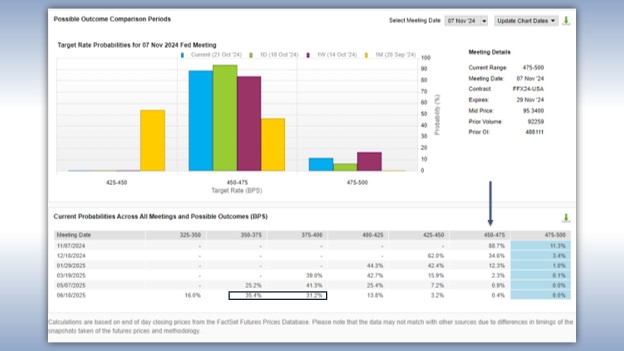
As far as the direction of interest rates is concerned, the market is anticipating an 89% chance of a 25-basis point cut in the upcoming Fed meeting on November 7. And by June of 2025, the market expects a further 100-125 basis points worth of cuts, dropping the Fed funds rate down to 3.5-4%.
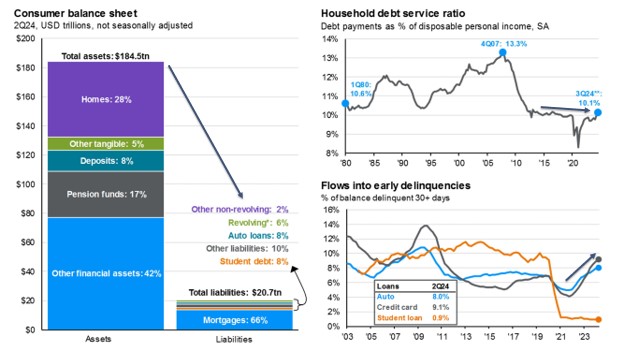
Meanwhile, the state of the economy remains strong as high yield bond spreads continue to fall indicating that investors are willing to buy junk-rated, high-risk bonds and have faith the high credit risk firms backing these bonds will continue to pay off their debt. Likewise, the consumer balance sheet remains incredibly strong with asset prices dramatically exceeding liabilities. The household debt service ratio has been on the rise but has essentially just returned to the pre-pandemic level, further indicating that consumers are in great shape financially. Although auto and credit card delinquencies are on the rise.
Thanks for joining for the monthly market update! We have a new podcast called “Business Tales.” You can find Business Tales on all your favorite podcasting apps. Also, our website is full of economic, financial planning, and market content. For those looking for more information please visit our website at signaturewmg.com. And don’t forget to like and subscribe.
Sources:
- FactSet Research Systems. (n.d.). S&P 500 (Interactive Charts). Retrieved October 22, 2024, from FactSet Database.
- Capital Group, “Guide to investing in an election year.” 2024 Edition. Retrieved from https://www.capitalgroup.com/advisor/insights/ebook-guide-investing-election-year.html
- FactSet Research Systems. (n.d.). S&P 500, S&P 600, and equal weight S&P 500 (interactive charts). Retrieved October 22, 2024, from FactSet Database.
- FactSet Research Systems. (n.d.). Financials, industrials, VNQ, and consumer discretionary (interactive charts). Retrieved October 22, 2024, from FactSet Database.
- FactSet Research Systems. (n.d.). Policy rate tracker (Markets). Retrieved October 22, 2024, from FactSet Database.
- JP Morgan Asset Management. “JP Morgan Guide to the Markets.” Slide 20, Consumer Finances. 4Q 2024, as of September 30, 2024. Retrieved from https://am.jpmorgan.com/us/en/asset-management/adv/insights/market-insights/guide-to-the-markets/?gad_source=1&gclid=Cj0KCQjwmt24BhDPARIsAJFYKk17LdPjIaAwlZm2xGBwLe8mD6AUgbR-XEEAet38FEDjGNTT0v6tSX0aAgUYEALw_wcB&gclsrc=aw.ds
Signature Wealth Management Group is registered as an investment adviser with the SEC. Signature Wealth only transacts business in states where it is properly registered, or is excluded or exempted from registration requirements.
Information presented is believed to be factual and up-to-date, but we do not guarantee its accuracy and it should not be regarded as a complete analysis of the subjects discussed. All expressions of opinion reflect the judgment of the author as of the date of publication and are subject to change.
Information contained herein does not involve the rendering of personalized investment advice, but is limited to the dissemination of general information.
The Standard & Poor’s 500 (S&P 500) is an unmanaged group of securities considered to be representative of the stock market in general.
The federal funds rate refers to the target interest rate set by the Federal Open Market Committee (FOMC). This target is the rate at which commercial banks borrow and lend their excess reserves to each other overnight.
Always consult an attorney or tax professional regarding your specific legal or tax situation.
The S&P 600 index tracks a broad range of small-sized companies that meet specific liquidity and stability requirements. This is determined by specific metrics such as public float, market capitalization, and financial viability, among other factors. To be listed on the S&P 600, stocks must have a market cap of $850 million to $3.6 billion, preventing overlap with S&P’s larger cap indices.
Past performance does not guarantee future results. Consult your financial professional before making any investment decision.
Forward-looking statements are not guarantees, and they involve risks, uncertainties and assumptions. The use of words such as “will”, “may”, “could”, “should”, and “would”, as well as any other statement that necessarily depends on future events, are intended to identify forward-looking statements.
Information is not an offer to buy or sell, or a solicitation of any offer to buy or sell the securities mentioned herein.
The S&P U.S. Style Indices measure the performance of U.S. equities fully or partially categorized as either growth or value stocks, as determined by Style Scores for each security. The Style series is weighted by float-adjusted market capitalization (FMC), and the Pure Style index series is weighted by Style Score subject to the rules described in Index Construction.
All information presented prior to an index’s Launch Date is hypothetical (back-tested), not actual performance. The Index returns shown do not represent the results of actual trading of investable assets/securities. S&P Dow Jones Indices LLC maintains the Index and calculates the Index levels and performance shown or discussed, but does not manage actual assets. Please refer to the methodology paper for the Index, available at www.spdji.com for more details about the index, including the manner in which it is rebalanced, the timing of such rebalancing, criteria for additions and deletions, as well as all index calculations.
The Consumer Price Index (CPI) is a measure that examines the weighted average of prices of a basket of consumer goods and services, such as transportation, food, and medical care. It is calculated by taking price changes for each item in the predetermined basket of goods and averaging them. Changes in the CPI are used to assess price changes associated with the cost of living.
