
November 27, 2024
Market Update: November 19th, 2024
Welcome to the Monthly Market Update from Signature Wealth Management. I’m Brian Ransom, Research Director from Signature Wealth and here’s what happened in the market this month.
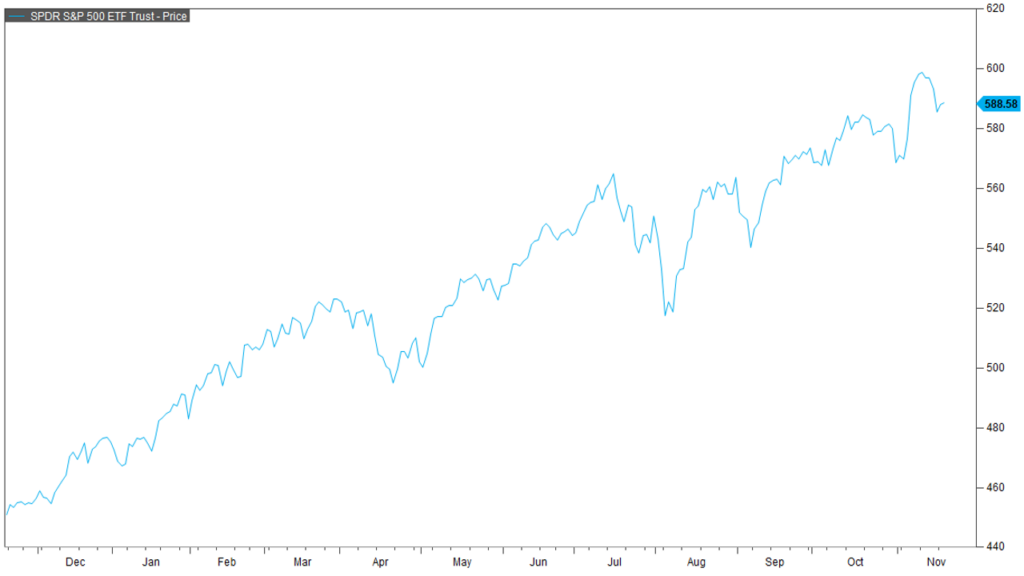
We got a nice little pop in the stock market in the week following the election. Between November 4 and November 14, the market was up about 5%. The market did quickly reach overbought territory on a short-term basis and gave some of the returns back, however.
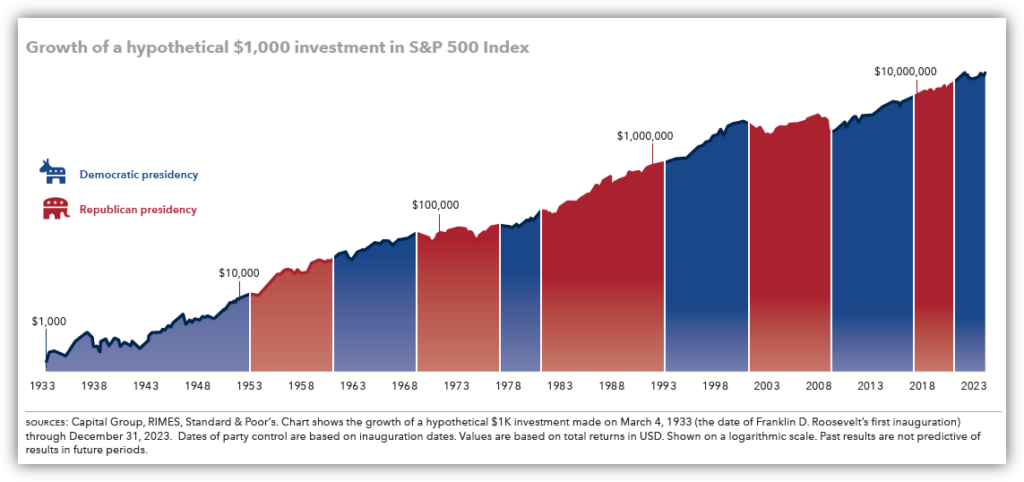
I will reiterate, once again, that there is no statistical difference in returns between a Republican presidency and a Democratic presidency. Long term, the party in power has little control over market performance.
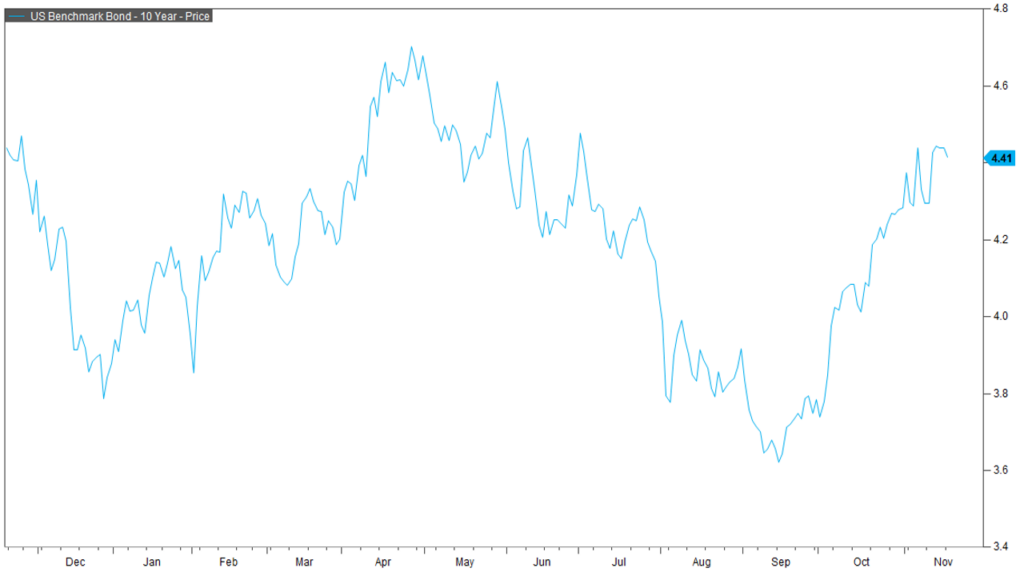
Here’s one thing that does matter to the markets though: yields on bonds. Shown here is the yield on the 10-year treasury. This yield has spent the bulk of the spring and summer falling in anticipation of rate cuts from the Federal Reserve. However, the 10-year yield bottomed on September 16, just 2 days before the first cut announcement from the Federal Reserve. It has been rising ever since.
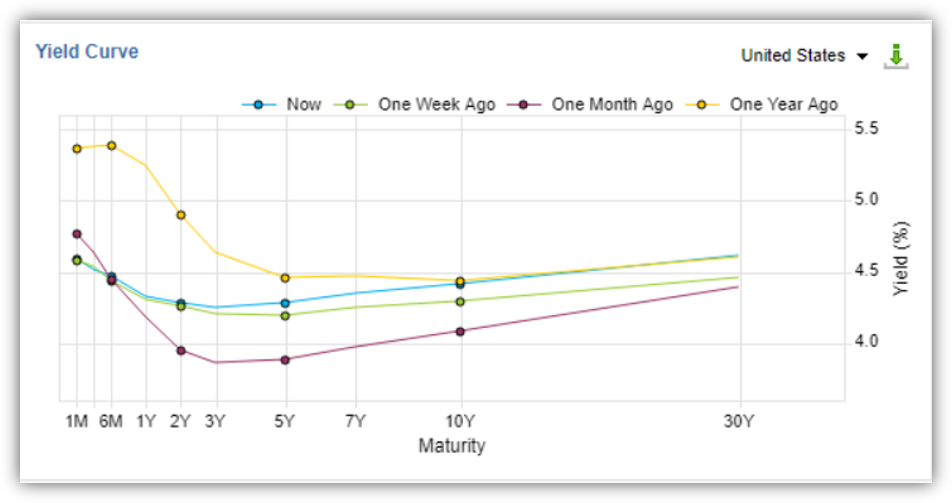
Why are rates rising when the Federal Reserve is actively cutting rates, you might ask? Well, technically the Federal Reserve only controls 1 of the 6 major Treasury rates. Technically, it doesn’t control any but for simplicities sake, they kind of do control the 1-month treasury rate. Shown here is the yield curve with maturity dates on the treasury curve on the x-axis. The only rate that is controlled by the Fed is this rate right here. You can seen the effect of the 50 bps cut back in September with the difference between the yield curve 1 year ago in yellow and the curve 1 month ago in purple. Last week’s 25 bps cut is shown right here. But the rest of the yields including the 10-year treasury are not actually controlled by the Fed and respond to other market forces including investor demand like banks and foreign entities, inflation, and economic growth. Higher inflation and economic growth tend to bid up treasury yields while falling inflation and recessions tend to push them down.
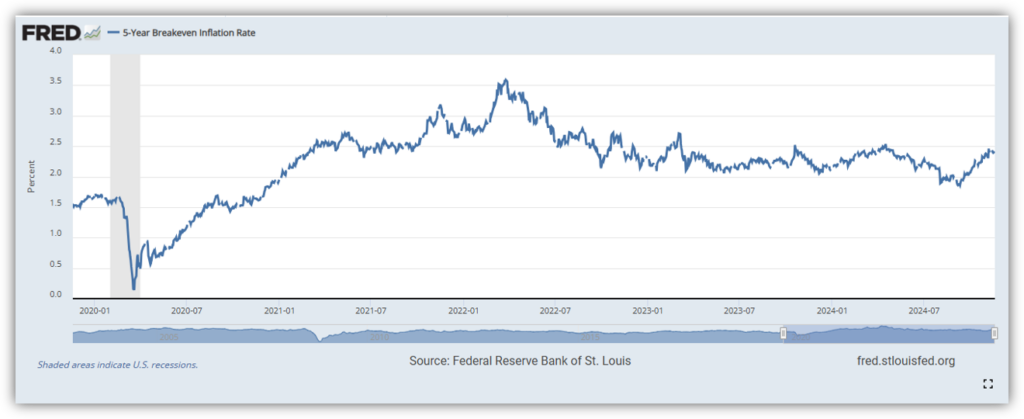
Importantly, the long-term yields are very much forward looking, factoring in changes to the economy often before they even show themselves in the data. As an example, while it’s true that inflation has been falling steadily from the 2022 peak, the 5-year breakeven inflation rate has actually been increasing since September. This rate is the implied forward 5-year inflation rate as measured by the difference between inflation-protected treasuries and the treasuries themselves. While, this short-term trend is far from confirming significant forward inflation, it’s worth keeping an eye on and it does imply shifting concerns in the markets just beneath the surface.
Thanks for joining for the monthly market update! We have a new podcast called “Business Tales.” You can find Business Tales on all your favorite podcasting apps. Also, our website is full of economic, financial planning, and market content. For those looking for more information please visit our website at signaturewmg.com. And don’t forget to like and subscribe.
Resources:
- FactSet Research Systems. (n.d.). S&P 500 (Interactive Charts). Retrieved November 19, 2024, from FactSet Database.
- Capital Group, “Guide to investing in an election year.” 2024 Edition. Retrieved from https://www.capitalgroup.com/advisor/insights/ebook-guide-investing-election-year.html
- FactSet Research Systems. (n.d.). 10-year US treasury yield (interactive charts). Retrieved November 19, 2024, from FactSet Database.
- FactSet Research Systems. (n.d.). Treasury yield curve (markets). Retrieved November 19, 2024, from FactSet Database.
- FactSet Research Systems. (n.d.). Total CPI YoY% (interactive charts). Retrieved November 19, 2024, from FactSet Database.
Federal Reserve Bank of St. Louis, 5-Year Breakeven Inflation Rate [T5YIE], retrieved from FRED, Federal Reserve Bank of St. Louis; https://fred.stlouisfed.org/series/T5YIE, November 19, 2024
Signature Wealth Management Group is registered as an investment adviser with the SEC. Signature Wealth only transacts business in states where it is properly registered, or is excluded or exempted from registration requirements.
Information presented is believed to be factual and up-to-date, but we do not guarantee its accuracy and it should not be regarded as a complete analysis of the subjects discussed. All expressions of opinion reflect the judgment of the author as of the date of publication and are subject to change.
Information contained herein does not involve the rendering of personalized investment advice, but is limited to the dissemination of general information.
The Standard & Poor’s 500 (S&P 500) is an unmanaged group of securities considered to be representative of the stock market in general.
The federal funds rate refers to the target interest rate set by the Federal Open Market Committee (FOMC). This target is the rate at which commercial banks borrow and lend their excess reserves to each other overnight.
Always consult an attorney or tax professional regarding your specific legal or tax situation.
The 10-year treasury note represents debt owed by the United States Treasury to the public. Since the U.S. government is seen as a risk-free borrower, investors use the 10-year treasury note as a benchmark for the long-term bond market.
Past performance does not guarantee future results. Consult your financial professional before making any investment decision.
Forward-looking statements are not guarantees, and they involve risks, uncertainties and assumptions. The use of words such as “will”, “may”, “could”, “should”, and “would”, as well as any other statement that necessarily depends on future events, are intended to identify forward-looking statements.
Information is not an offer to buy or sell, or a solicitation of any offer to buy or sell the securities mentioned herein.
The S&P U.S. Style Indices measure the performance of U.S. equities fully or partially categorized as either growth or value stocks, as determined by Style Scores for each security. The Style series is weighted by float-adjusted market capitalization (FMC), and the Pure Style index series is weighted by Style Score subject to the rules described in Index Construction.
All information presented prior to an index’s Launch Date is hypothetical (back-tested), not actual performance. The Index returns shown do not represent the results of actual trading of investable assets/securities. S&P Dow Jones Indices LLC maintains the Index and calculates the Index levels and performance shown or discussed, but does not manage actual assets. Please refer to the methodology paper for the Index, available at www.spdji.com for more details about the index, including the manner in which it is rebalanced, the timing of such rebalancing, criteria for additions and deletions, as well as all index calculations.
The Consumer Price Index (CPI) is a measure that examines the weighted average of prices of a basket of consumer goods and services, such as transportation, food, and medical care. It is calculated by taking price changes for each item in the predetermined basket of goods and averaging them. Changes in the CPI are used to assess price changes associated with the cost of living.
