
March 28, 2025
Market Update: March 21, 2025
Welcome to the Monthly Market Update from Signature Wealth Management. I’m Brian Ransom, Research Director from Signature Wealth and here’s what happened in the market this month.
Today marks the 5-year anniversary of the 2020 Covid Pandemic low. At the time, the market had fallen about 33% over the course of 3 weeks, marking one of the fastest developing bear markets of all time. The market tripped 4 circuit breakers in 10 days where all trading was halted for a period of time before re-opening. We saw negative pricing on oil futures for the first time ever where you could get paid to take barrels of oil off producers’ hands. And trillions of dollars were poured into the markets by the Fed and the Federal Government, which subsequently triggered the 2022 bear market 2 years later. Despite all that, the market is up 153% between March 23, 2020 and March 21, 2025.
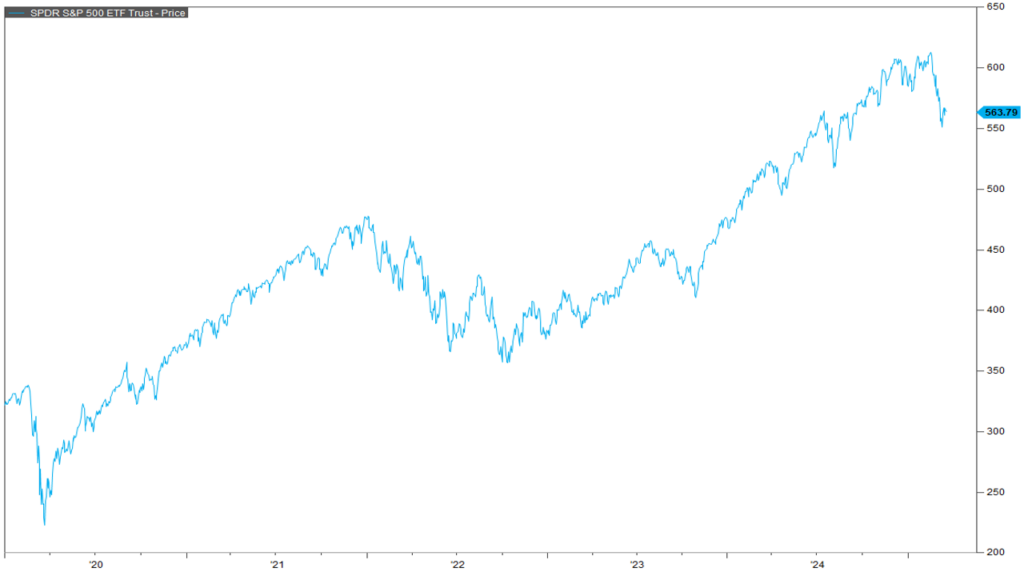
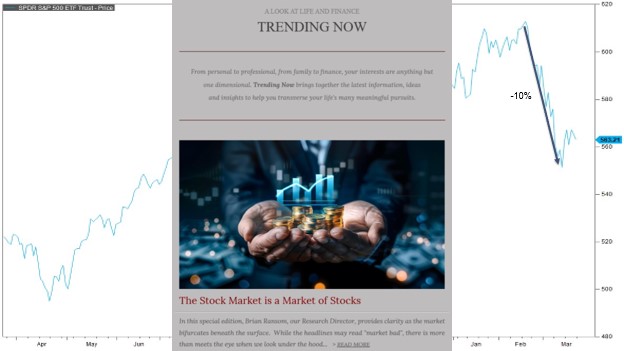
And that brings us to today’s market which has seen some increased volatility including a 10% drop in price between February 19, 2025 and March 13, 2025. While the market is up from that March 13 bottom, it does not appear to have the momentum to break the down trend as of March 21. But, in my most recent newsletter that went out earlier this month titled “The Stock Market is a Market of Stocks,” I explain that despite the poor performance from the S&P 500, not everything is down in 2025.
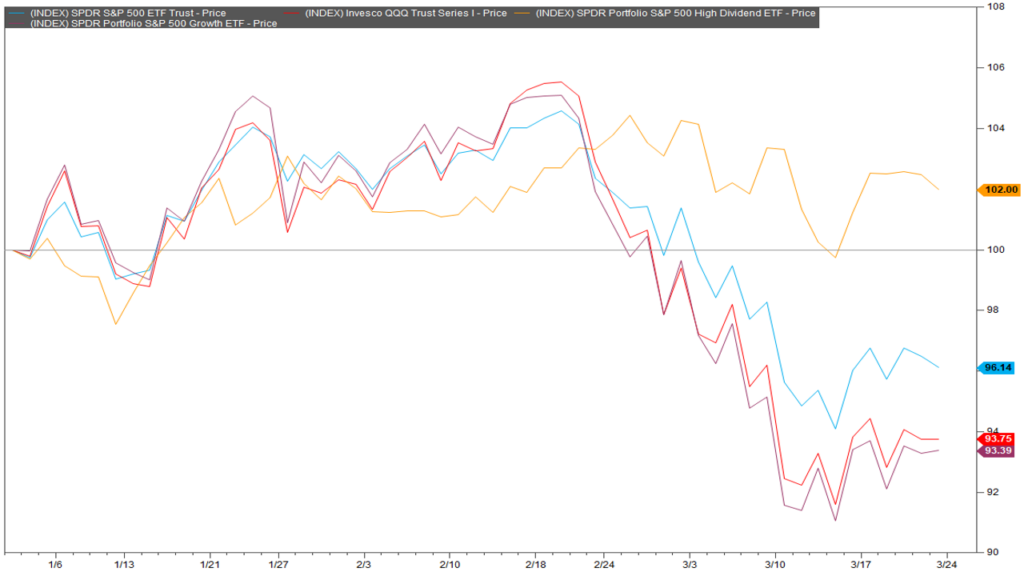
I wanted to spend some time in this video, highlighting and updating a few of the graphs in that newsletter. First, here is an updated graph showing the year-to-date returns from the S&P 500 in blue, the Nasdaq in red, the S&P 500 growth index in purple, and the S&P 500 high dividend index in orange. At the time, the dividend index was the only positive return of the 4 on the year. And that is still the case a couple of weeks later. Dividend investors have been rewarded this year.
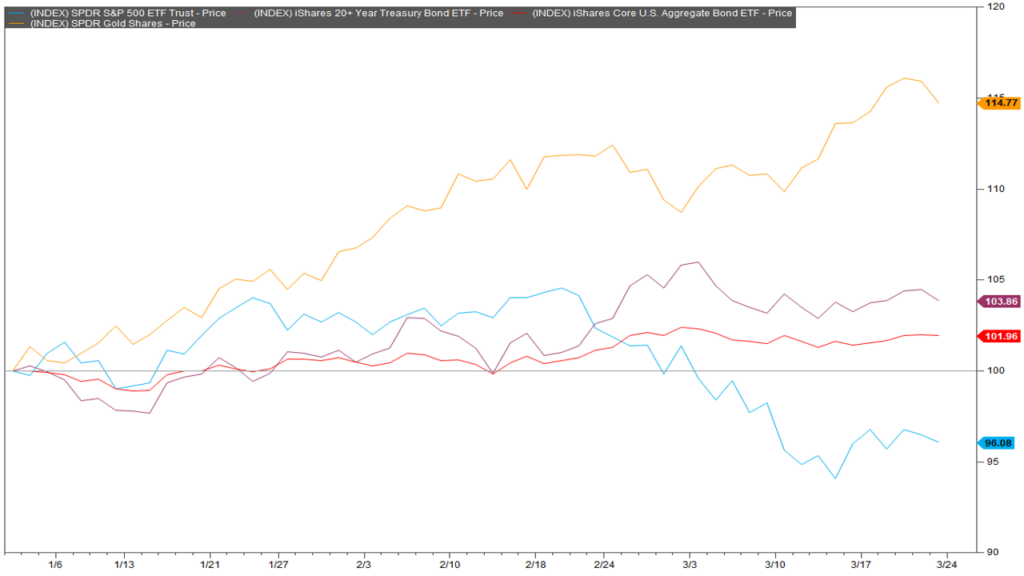
Next, let’s update gold in orange, treasuries in purple, and the aggregate bond index in red. All three remain positive on the year showing that diversified investors are probably doing just fine in 2025 despite all the scary headlines.
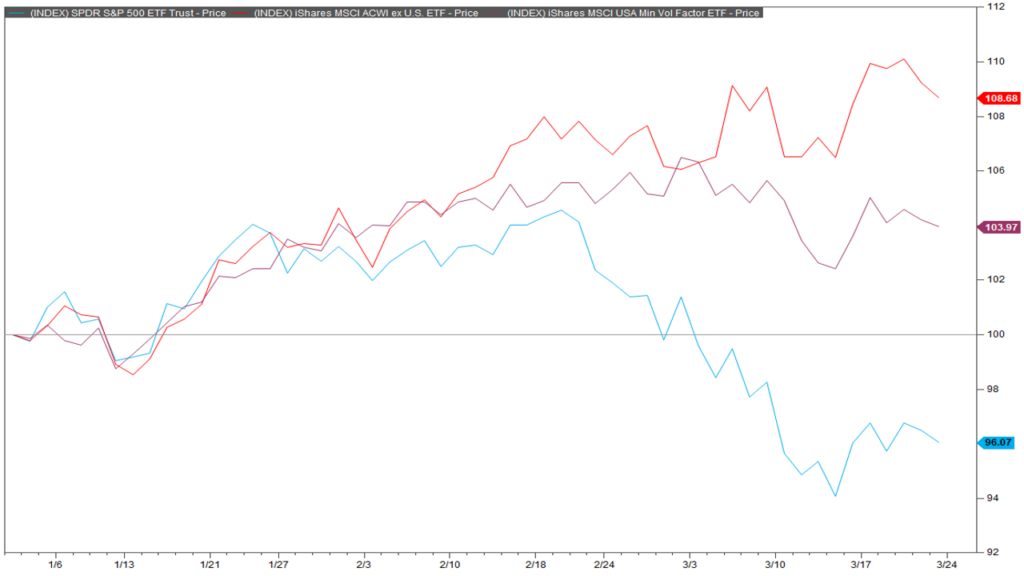
Likewise, international investors shown in red and low volatility investors shown in purple are also positive on the year.
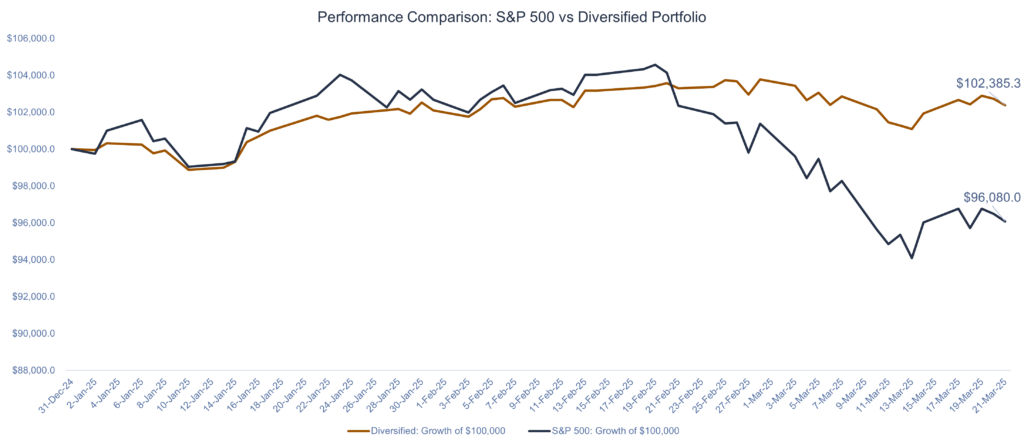
In fact, if you’re a diversified investor with an allocation shown as such, then this is what your performance looks like in 2025 despite all the headlines we’ve gotten so far this year. This is a very typical 60/40 stocks to bonds portfolio and this portfolio is up about 2.4% year-to-date or $2,400 on a $100,000 portfolio. Compared to passive investors in the S&P 500 shown in blue who are down about $4,000 as of March 21, 2025.
 Data from FactSet interactive charts retrieved March 21, 2025
Thanks for joining for the monthly market update! We have a new podcast called “Business Tales.” You can find Business Tales on all your favorite podcasting apps. Also, our website is full of economic, financial planning, and market content. For those looking for more information please visit our website at signaturewmg.com. And don’t forget to like and subscribe.
Sources:
1.FactSet Research Systems. (n.d.). S&P 500 (Interactive Charts). Retrieved March 21, 2025, from FactSet Database.
2.FactSet Research Systems. (n.d.). S&P 500, QQQ, SPYG, SPYD (Interactive Charts). Retrieved March 21, 2025, from FactSet Database.
3.FactSet Research Systems. (n.d.). S&P 500, GLD, TLT, AGG (Interactive Charts). Retrieved March 21, 2025, from FactSet Database.
4.FactSet Research Systems. (n.d.). S&P 500, ACWX, USMV (Interactive Charts). Retrieved March 21, 2025, from FactSet Database.
Disclosures:
Signature Wealth Management Group is registered as an investment adviser with the SEC. Signature Wealth only transacts business in states where it is properly registered, or is excluded or exempted from registration requirements.
Information presented is believed to be factual and up-to-date, but we do not guarantee its accuracy and it should not be regarded as a complete analysis of the subjects discussed. All expressions of opinion reflect the judgment of the author as of the date of publication and are subject to change.
Information contained herein does not involve the rendering of personalized investment advice, but is limited to the dissemination of general information.
The Standard & Poor’s 500 (S&P 500) is an unmanaged group of securities considered to be representative of the stock market in general.
Always consult an attorney or tax professional regarding your specific legal or tax situation.
The S&P 500 High Dividend Index serves as a benchmark for income seeking equity investors. The index is designed to measure the performance of 80 high yield companies within the S&P 500 and is equally weighted to best represent the performance of this group, regardless of constituent size.
The S&P 500® Growth measures constituents from the S&P 500 that are classified as growth stocks based on three factors: sales growth, the ratio of earnings change to price, and momentum.
Invesco QQQ is passively managed and tracks the Nasdaq-100 index, which offers exposure to many industry-leading companies in a single investment.
The Nasdaq Composite is an index of the common stocks and similar securities listed on the NASDAQ stock market and is considered a broad indicator of the performance of stocks of technology companies and growth companies.
SPDR® Gold Shares are intended to offer investors a means of participating in the gold bullion market without the necessity of taking physical delivery of gold, and to buy and sell that interest through the trading of a security on a regulated stock exchange.
The iShares 20+ Year Treasury Bond ETF seeks to track the investment results of an index composed of U.S. Treasury bonds with remaining maturities greater than twenty years.
The iShares Core U.S. Aggregate Bond ETF (AGG) is an exchange-traded fund (ETF) that provides broad exposure to the U.S. investment-grade bond market, seeking to track the Bloomberg U.S. Aggregate Bond Index.
The MSCI ACWI is a global equity index that measures the equity performance in both the developed and emerging markets.
The iShares MSCI USA Min Vol Factor ETF seeks to track the investment results of an index composed of U.S. equities that, in the aggregate, have lower volatility characteristics relative to the broader U.S. equity market.
Past performance does not guarantee future results. Consult your financial professional before making any investment decision.
Forward-looking statements are not guarantees, and they involve risks, uncertainties and assumptions. The use of words such as “will”, “may”, “could”, “should”, and “would”, as well as any other statement that necessarily depends on future events, are intended to identify forward-looking statements.
Information is not an offer to buy or sell, or a solicitation of any offer to buy or sell the securities mentioned herein.
The S&P U.S. Style Indices measure the performance of U.S. equities fully or partially categorized as either growth or value stocks, as determined by Style Scores for each security. The Style series is weighted by float-adjusted market capitalization (FMC), and the Pure Style index series is weighted by Style Score subject to the rules described in Index Construction.
All information presented prior to an index’s Launch Date is hypothetical (back-tested), not actual performance. The Index returns shown do not represent the results of actual trading of investable assets/securities. S&P Dow Jones Indices LLC maintains the Index and calculates the Index levels and performance shown or discussed, but does not manage actual assets. Please refer to the methodology paper for the Index, available at www.spdji.com for more details about the index, including the manner in which it is rebalanced, the timing of such rebalancing, criteria for additions and deletions, as well as all index calculations.