
August 29, 2024
Market Update: August 20th, 2024
Welcome to the Monthly Market Update from Signature Wealth Management. I’m Brian Ransom, Research Director from Signature Wealth and here’s what happened in the market this month.
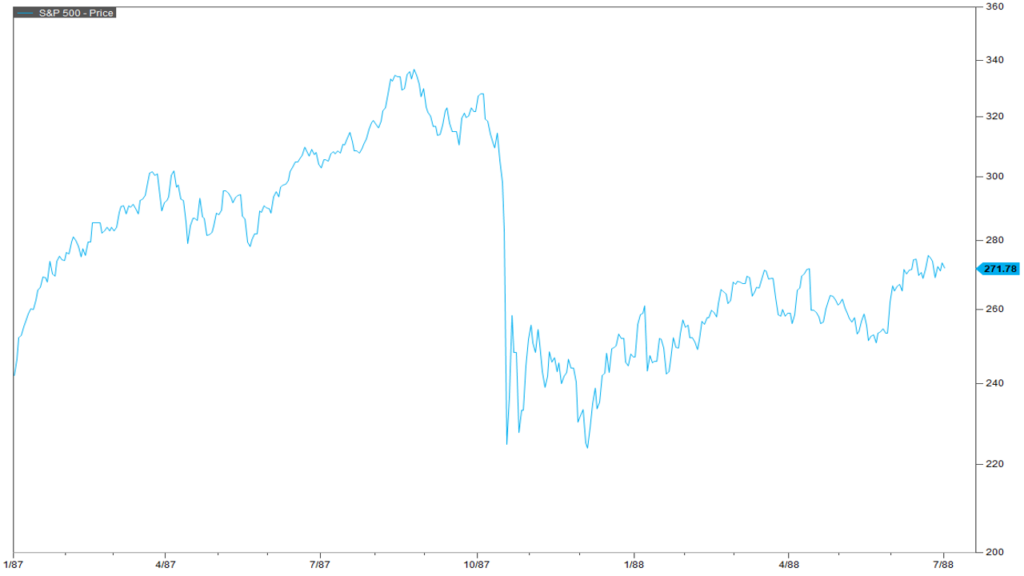
So this month we had our first bout of volatility in a while. The early August selloff was sparked by margin calls on Japanese Yen carry trades. That’s a bunch of words that essentially mean people were over-levered, they were caught offsides, and had to sell as a result. Even though this is the same exact trade that caused the 1987 market crash, the worst single day stock market crash in history, a Japanese carry trade is not a serious long-term cause of concern for the economy.
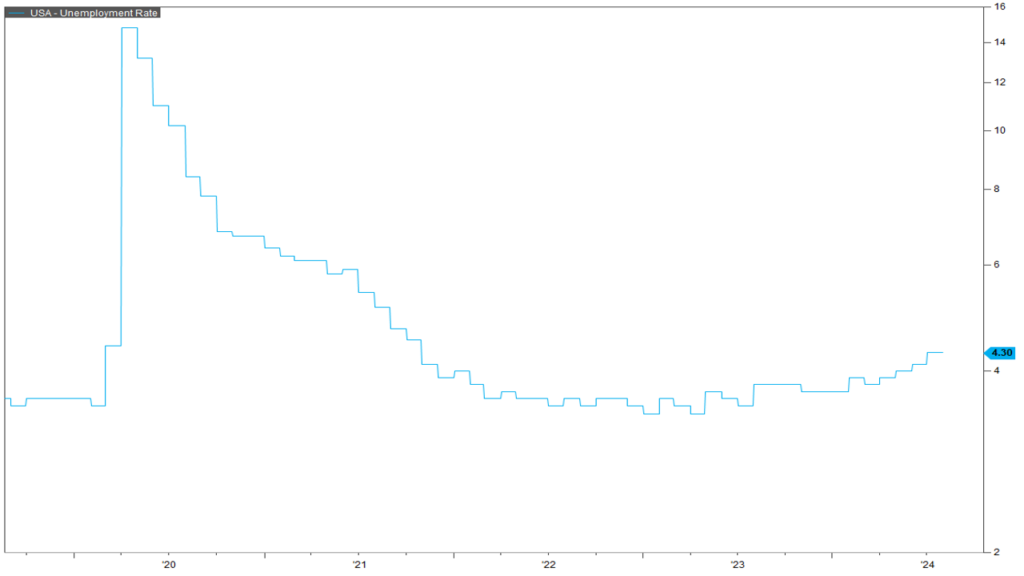
This is a more serious threat to the long-term health of the economy, rising unemployment. Earlier this year, the unemployment rate rose above 4% for the first time since early 2022, triggering the newly developed “Sahm Rule” named after Dr. Claudia Sahm. This indicator was developed as an early warning sign for the Federal Reserve to start easing monetary conditions during the early stages of a recession. Historically, this rule has been fairly accurate at predicting recessions. But there are occasional false positives and Dr. Sahm herself does believe that this 2024 trigger is a false positive. However, the number of times the Federal Reserve is mentioned in earnings calls is on the rise. CEO’s are indicating that their income statements are stressed because of tight monetary conditions and if those conditions aren’t eased then layoffs may follow.
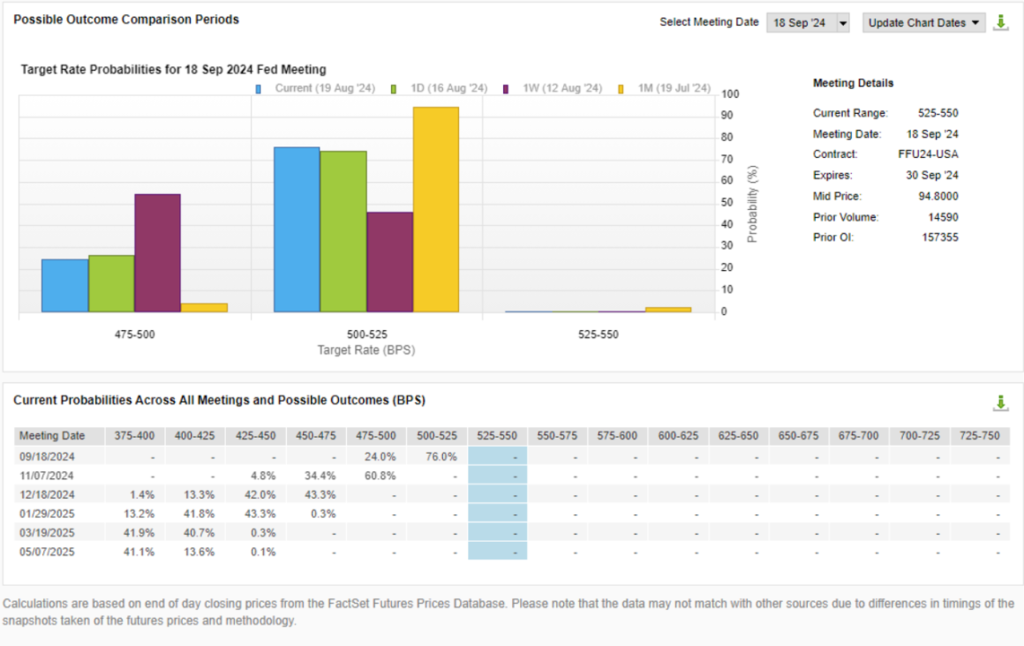
And here’s where we stand on that. Currently the market is anticipating a 75% chance of a 25 bps point cut for the upcoming Federal Reserve meeting on September 18.
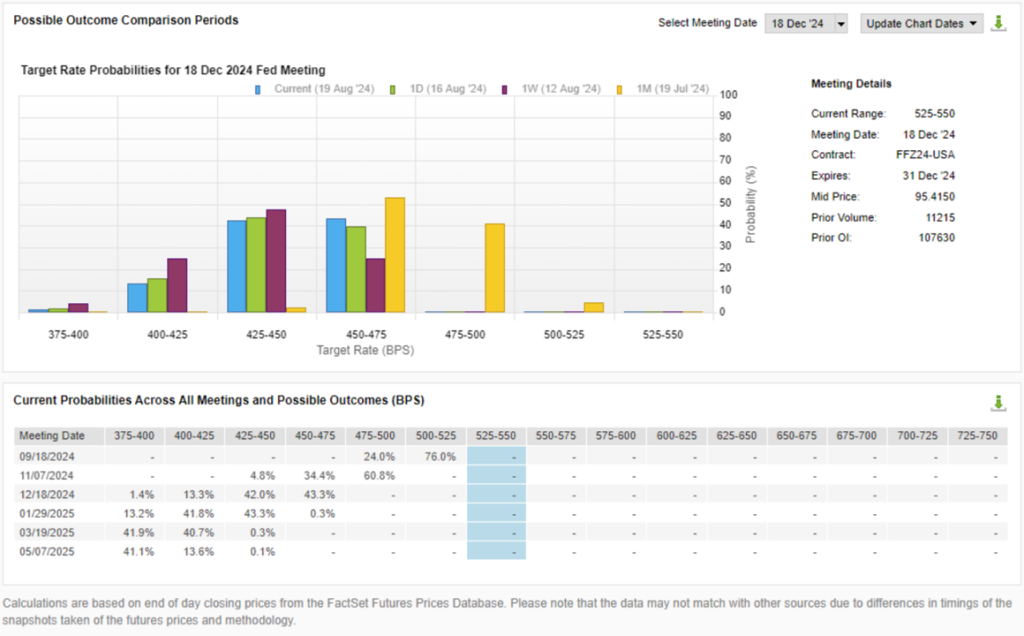
By the end of the year, the market further anticipates another 2-3 25 bps cuts to end the year with short term interest rates in the range of 4.25% to 4.75%. By the way, this directly impact interest earned on bank saving accounts, money market funds, CD’s, and short-term bonds. But it also lowers interest rates on Mortgages, credit cards, bank loans, home equity lines of credit, etc. This in turn should give a boost to consumer spending over time. By May of 2025, the market anticipates short term interest rates to fall below 4%.
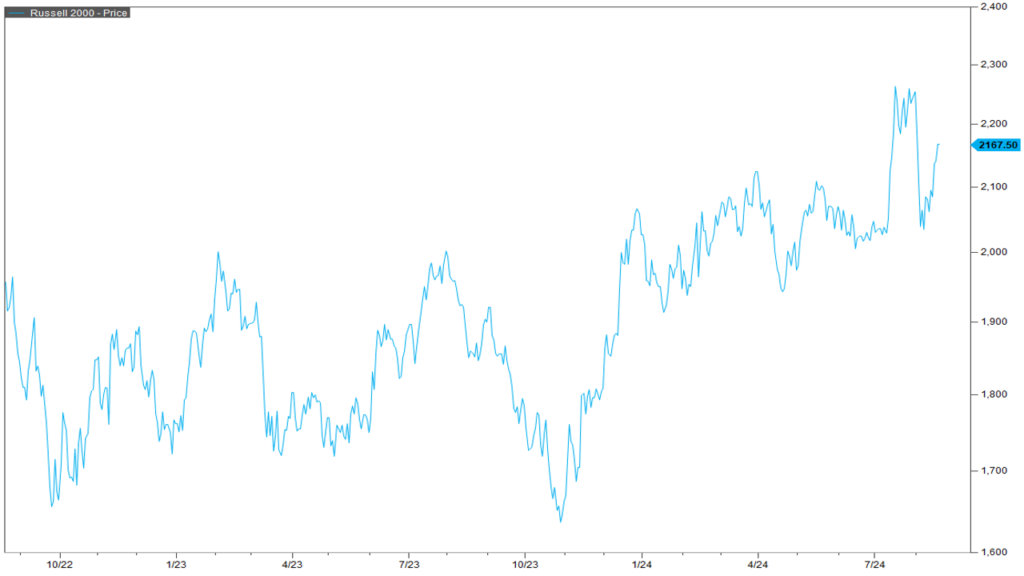
The impact of this dynamic between rising unemployment and easing monetary conditions can be tracked through two primary sources. The first is in small cap stock performances, as measured by the Russell 2000 shown here. Because small caps typically have higher borrowing rates than large caps, changes in interest rates have a greater impact on small cap performance. Back in late July, before unemployment concerns started hitting the headlines, it appeared that small caps were ready to break out. This quickly reversed in August with the triggering of the Sahm Rule, but has since recovered a portion of the losses. If this positive trend continues then that’s a positive sign for the economy.
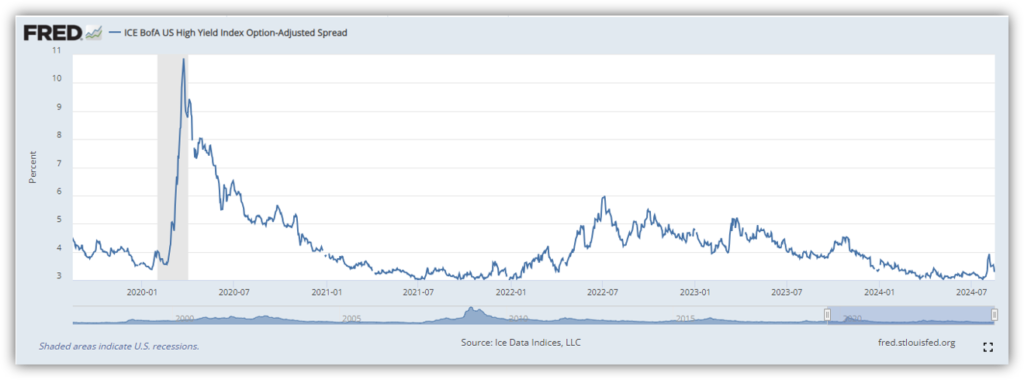
The second indicator of economic health is the high yield bond spread. If there is economic pressure of high yield borrowers, then the spreads blow out like we saw during Covid, giving a real time indication of economic strength or weakness. This month, we saw a small little blip of increasing spread but that has since eased over the last week.
Thanks for joining for the monthly market update! We have a new podcast called “Business Tales.” You can find Business Tales on all your favorite podcasting apps. Also, our website is full of economic, financial planning, and market content. For those looking for more information please visit our website at signaturewmg.com. And don’t forget to like and subscribe.
SOURCES:
- FactSet Research Systems. (n.d.). S&P 500 (Interactive Charts). Retrieved August 20, 2024, from FactSet Database.
- FactSet Research Systems. (n.d.). Policy Rate Tracking (Markets). Retrieved August 20, 2024, from FactSet Database.
- FactSet Research Systems. (n.d.). Russell 2000 (interactive charts). Retrieved August 20, 2024, from FactSet Database.
- Ice Data Indices, LLC, ICE BofA US High Yield Index Option-Adjusted Spread [BAMLH0A0HYM2], retrieved from FRED, Federal Reserve Bank of St. Louis, https://fred.stlouisfed.org/series/BAMLH0A0HYM2, August 20, 2024.
Signature Wealth Management Group is registered as an investment adviser with the SEC. Signature Wealth only transacts business in states where it is properly registered, or is excluded or exempted from registration requirements.
Information presented is believed to be factual and up-to-date, but we do not guarantee its accuracy and it should not be regarded as a complete analysis of the subjects discussed. All expressions of opinion reflect the judgment of the author as of the date of publication and are subject to change.
Information contained herein does not involve the rendering of personalized investment advice, but is limited to the dissemination of general information.
The Standard & Poor’s 500 (S&P 500) is an unmanaged group of securities considered to be representative of the stock market in general.
The Russell 2000 index is a small-cap US stock market index that makes up the smallest 2,000 stocks in the Russell index. The index is maintained by FTSE Russell, a subsidiary of the London Stock Exchange Group.
The 10-year treasury note represents debt owed by the United States Treasury to the public. Since the U.S. Government is seen as a risk-free borrower, investors use the 10-year Treasury Note as a benchmark for the long-term bond market.
The federal funds rate refers to the target interest rate set by the Federal Open Market Committee (FOMC). This target is the rate at which commercial banks borrow and lend their excess reserves to each other overnight.
Always consult an attorney or tax professional regarding your specific legal or tax situation.
Past performance does not guarantee future results. Consult your financial professional before making any investment decision.
Forward-looking statements are not guarantees, and they involve risks, uncertainties and assumptions. The use of words such as “will”, “may”, “could”, “should”, and “would”, as well as any other statement that necessarily depends on future events, are intended to identify forward-looking statements.
Information is not an offer to buy or sell, or a solicitation of any offer to buy or sell the securities mentioned herein.
The S&P U.S. Style Indices measure the performance of U.S. equities fully or partially categorized as either growth or value stocks, as determined by Style Scores for each security. The Style series is weighted by float-adjusted market capitalization (FMC), and the Pure Style index series is weighted by Style Score subject to the rules described in Index Construction.
All information presented prior to an index’s Launch Date is hypothetical (back-tested), not actual performance. The Index returns shown do not represent the results of actual trading of investable assets/securities. S&P Dow Jones Indices LLC maintains the Index and calculates the Index levels and performance shown or discussed, but does not manage actual assets. Please refer to the methodology paper for the Index, available at www.spdji.com for more details about the index, including the manner in which it is rebalanced, the timing of such rebalancing, criteria for additions and deletions, as well as all index calculations.
The Consumer Price Index (CPI) is a measure that examines the weighted average of prices of a basket of consumer goods and services, such as transportation, food, and medical care. It is calculated by taking price changes for each item in the predetermined basket of goods and averaging them. Changes in the CPI are used to assess price changes associated with the cost of living.
