August 29, 2024
The SWMG Opinion on the Election
We have none.
Ah yes, another election year full of divisive, negative, and persuasive rhetoric from folks on both sides of the aisle. We all recognize the importance of such a year and the ability to have a vote in electing our leaders, but we cannot help feeling some level of dread and outright exhaustion as the process plays itself out. I (Ian) am sorry to disappoint you if you were hoping to discover Jim’s, Scott’s, Curt’s, or any of the rest of the team’s political opinions in this article. This is meant to serve as a history lesson into market’s during and following election years as well as insight into what we look for as we navigate the markets for our clients.
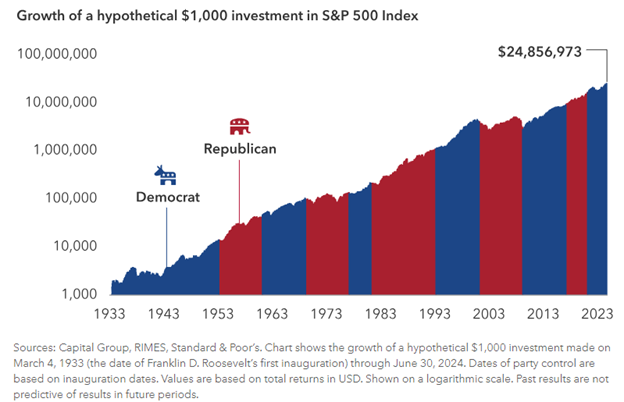
I want to start off with a shocking statistic that most people do not realize: the markets have trended higher regardless of which party is represented in the white house. Here is a chart to prove my point:

Crazy right? The way the media talks about the markets would make it seem that their preferred party is better for the markets than the other. You will often hear that this presidential election is the most important in recent memory, which for the coming 4 years is true. However, we have also said the same thing about every presidential race before and we will continue to say it going forward. The point I am trying to make is that the most important thing you can do as an investor is continue to stay invested for the long-term.
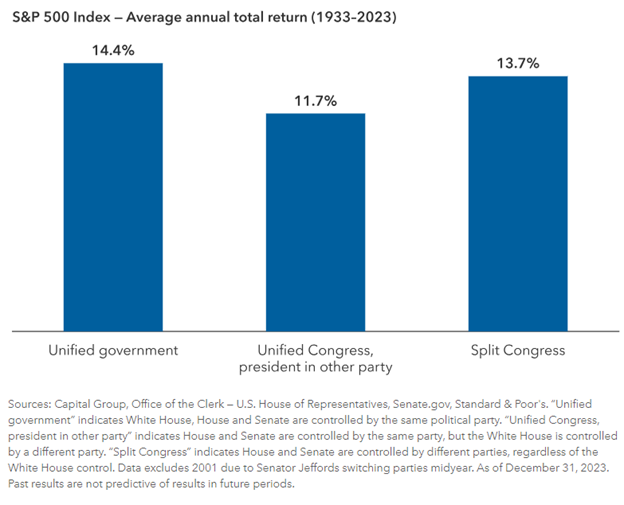
Well okay, what about congressional election’s influence on the markets? After all, a president’s policies are only as influential as their ability to get through congress. The first bar of the chart below is the average annual return for a government where the house, senate, and president are all from the same party. The second is when both the house and senate majorities are the same party, but the president is from the other. The third bar is when the house and senate majorities are different parties.

A unified congress with a president in the opposite party yielded a lower average annual return than the rest, but was still a robust 11.7%. For context, we only assume average annual rates of return in the 5-7% range for our financial plans. Most fear that the other party having a unified government will lead to a flailing economy and an abysmal market, but statistically that has not been the case.
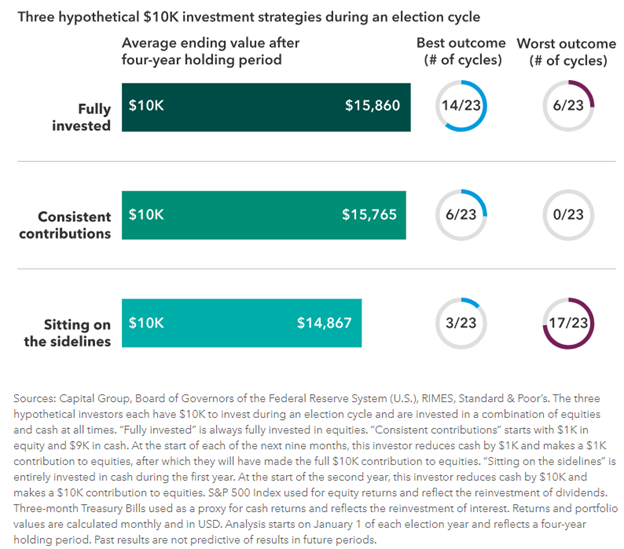
The last point I want to make is that being long-term investors means staying invested for the long haul, not trying to time the market based on political preference. Capital Group (which provided the two charts above) did some math on how 3 hypothetical investors, each with a different investment approach, would have performed in each 4-year election cycle since 1933 and here are the results:

As we can see, being fully invested or contributing consistently to the strategy yielded the best results in 20/23 cycles. Sitting on the sidelines for a year and then investing in year 2 of the cycle yielded the worst performance 17/23 cycles. This study was used to reinforce the point that ignoring the short-term noise in favor of long-term investing is more important than the people sitting in Washington DC.
With all that said, your vote still matters. Your opinion is yours and the benefit of living in the USA is that you can use your vote as a way of expressing your opinion on the direction of our country’s politics. However, using political beliefs to guide an account’s investments has not been a successful investment strategy regardless of which side of the aisle you may vote for. Of course, past results are not indicative of future returns, but we can use the past as a way to observe what has happened in order to better inform ourselves going forward. Here at SWMG, we believe in arming our clients with information and education, which our media does not always do a good job in doing. We also believe in investing in companies that are in line with our long-term investment strategies. As we enter the fall, please speak your mind and express your opinions using your vote, but be aware that political results have not proved to be significantly different for long-term investors.
Source:
https://www.capitalgroup.com/advisor/insights/articles/how-elections-move-markets-5-charts.html
This material is for informational or educational purposes only.
Investing involves risk including the potential loss of principal. No investment strategy can guarantee a profit or protect against loss in periods of declining values.
Diversification does not guarantee profit nor is it guaranteed to protect assets.
Opinions expressed are subject to change without notice and are not intended as investment advice. Past performance does not guarantee future results.
