
August 1, 2024
Market Update: July 22, 2024
Welcome to the Monthly Market Update from Signature Wealth Management. I’m Brian Ransom, Research Director from Signature Wealth and here’s what happened in the market this month.
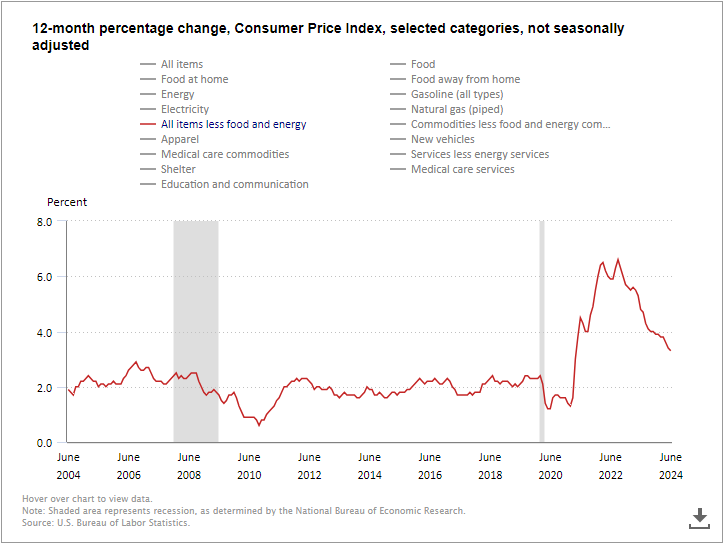
Let’s start off with a quick inflation update. Core inflation continues to fall indicating that the 2022 inflation cycle is nearing its end. This particular inflation reading triggered a market rotation into a variety of different stocks that had previously underperformed the tech-centric indices.
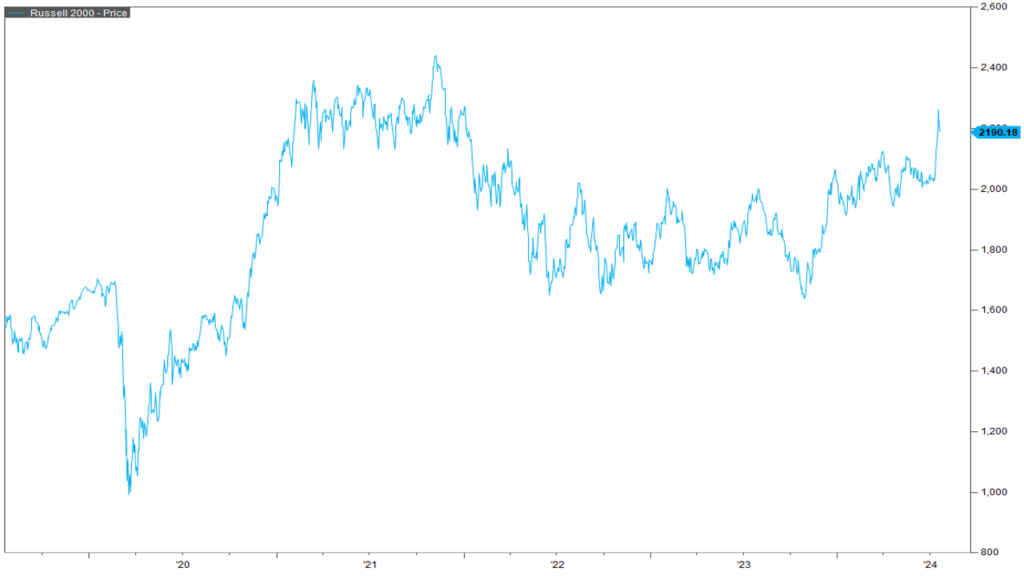
This includes a very strong rally in small caps as pictured here in the blue by the Russell 2000 index. Small caps, after recovering from the pandemic in 2020 and 2021, have largely underperformed the large cap indices and have not really participated in the rally since 2023 either. This most recent pop may signal a change in the market rally composition and a rotation into small caps which both benefit from falling interest rates (more on that later) and have much cheaper valuations.
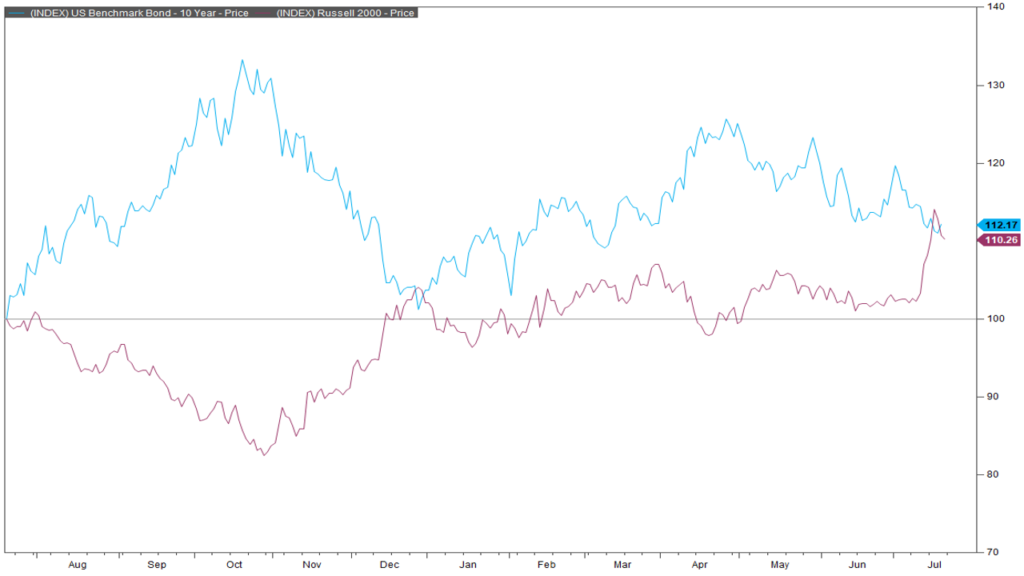
Small cap performance for the last year has been very closely tied to long term interest rates like the 10-year treasury yield shown here in blue. Since the summer of last year, small caps shown in purple have moved in the opposite direction as they 10-year yield. In the late summer of 2023, interest rates rose and small caps fell. In October of 2023, we had a small rotation into small caps that coincided with a falling 10-year. This most recent rally broke this trend but the performance from small caps is still very closely tied to interest rates.
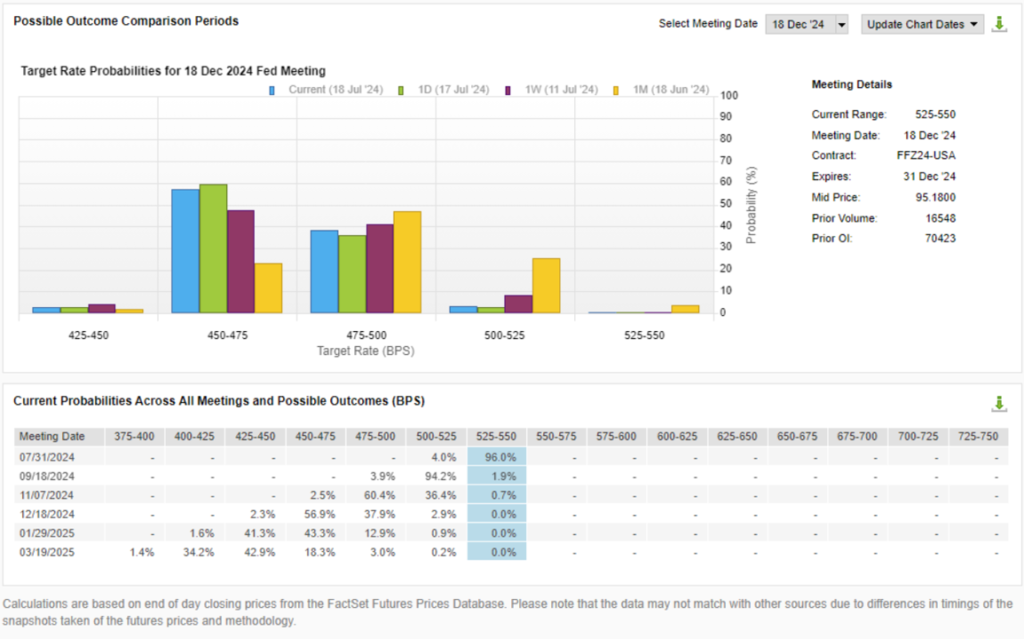
The relevant interest rate in this case in the Fed Funds rate, which is very likely going to be dropping over the next several months. Since the July CPI reading, the probability of getting 2 or even 3 interest rate cuts in the back half of the year has risen significantly. The most likely start date of the cuts is the September Federal Reserve meeting with a 94% expected chance of a 25 basis point cut with two other expected cuts at the November and December meeting to round out the year.
Small caps, or really anything that is not megacap tech, should benefit from this news. This is because a lower Fed Funds rate means lower borrowing rates for corporations big and small. It also means lower borrowing rates for consumers so we should see an increase in consumer spending and this also means corporations have easier access to capital. All of this should translate into lower borrowing costs and higher demand from consumers.
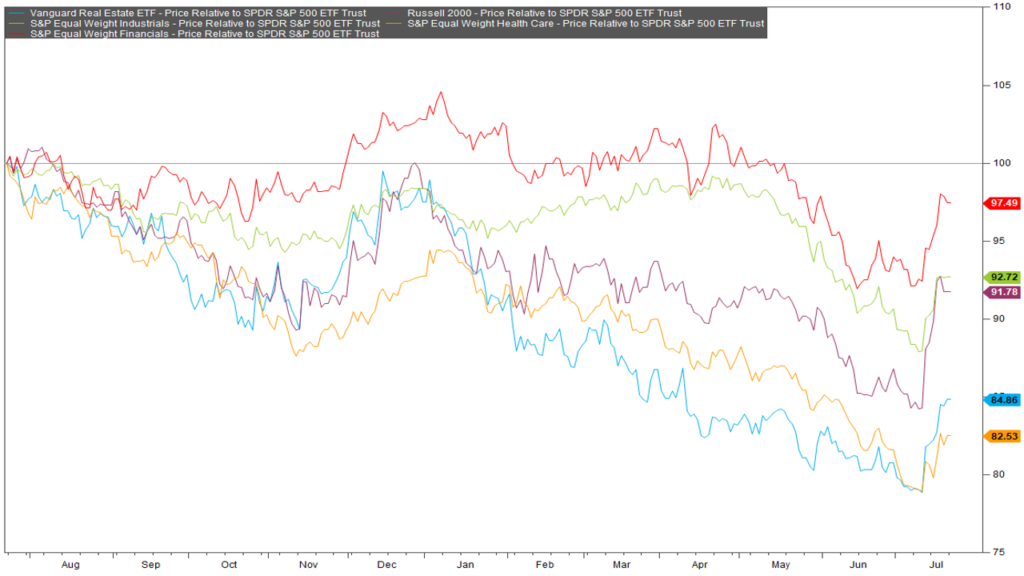
Small caps in purple have not been the only stocks to respond positively to rate cuts. So has real estate in blue, health care in orange, industrials in green, and financials in red. All of this points to a general broadening of returns theme throughout the markets where returns likely will not be as concentrated as they have been for the first half of the year.
Thanks for joining for the monthly market update! We have a new podcast called “Business Tales.” You can find Business Tales on all your favorite podcasting apps. Also, our website is full of economic, financial planning, and market content. For those looking for more information please visit our website at signaturewmg.com. And don’t forget to like and subscribe.
1.Bureau of Labor Statistics. Core Consumer Price Index. “12-month percentage change chart, selected categories (past 20 years).” Updated July 11, 2024. Retrieved from https://www.bls.gov/cpi/
2. FactSet Research Systems. (n.d.). Russell 2000 (interactive charts). Retrieved July 19, 2024, from FactSet Database.
3. FactSet Research Systems. (n.d.). Russell 2000 & 10-year US treasury yield (Interactive Charts). Retrieved July 19, 2024, from FactSet Database.
4. FactSet Research Systems. (n.d.). Policy Rate Tracking (Markets). Retrieved July 19, 2024, from FactSet Database.
5. FactSet Research Systems. (n.d.). Equal weight industrials, financials, Health Care, Russell 2000, and VNQ relative to S&P 500 (Interactive Charts). Retrieved July 22, 2024, from FactSet Database.
Signature Wealth Management Group is registered as an investment adviser with the SEC. Signature Wealth only transacts business in states where it is properly registered, or is excluded or exempted from registration requirements.
Information presented is believed to be factual and up-to-date, but we do not guarantee its accuracy and it should not be regarded as a complete analysis of the subjects discussed. All expressions of opinion reflect the judgment of the author as of the date of publication and are subject to change.
Information contained herein does not involve the rendering of personalized investment advice, but is limited to the dissemination of general information.
The Standard & Poor’s 500 (S&P 500) is an unmanaged group of securities considered to be representative of the stock market in general.
The Russell 2000 index is a small-cap US stock market index that makes up the smallest 2,000 stocks in the Russell index. The index is maintained by FTSE Russell, a subsidiary of the London Stock Exchange Group.
The 10-year treasury note represents debt owed by the United States Treasury to the public. Since the U.S. Government is seen as a risk-free borrower, investors use the 10-year Treasury Note as a benchmark for the long-term bond market.
The federal funds rate refers to the target interest rate set by the Federal Open Market Committee (FOMC). This target is the rate at which commercial banks borrow and lend their excess reserves to each other overnight.
Always consult an attorney or tax professional regarding your specific legal or tax situation.
Past performance does not guarantee future results. Consult your financial professional before making any investment decision.
Forward-looking statements are not guarantees, and they involve risks, uncertainties and assumptions. The use of words such as “will”, “may”, “could”, “should”, and “would”, as well as any other statement that necessarily depends on future events, are intended to identify forward-looking statements.
Information is not an offer to buy or sell, or a solicitation of any offer to buy or sell the securities mentioned herein.
The S&P U.S. Style Indices measure the performance of U.S. equities fully or partially categorized as either growth or value stocks, as determined by Style Scores for each security. The Style series is weighted by float-adjusted market capitalization (FMC), and the Pure Style index series is weighted by Style Score subject to the rules described in Index Construction.
All information presented prior to an index’s Launch Date is hypothetical (back-tested), not actual performance. The Index returns shown do not represent the results of actual trading of investable assets/securities. S&P Dow Jones Indices LLC maintains the Index and calculates the Index levels and performance shown or discussed, but does not manage actual assets. Please refer to the methodology paper for the Index, available at www.spdji.com for more details about the index, including the manner in which it is rebalanced, the timing of such rebalancing, criteria for additions and deletions, as well as all index calculations.
The Consumer Price Index (CPI) is a measure that examines the weighted average of prices of a basket of consumer goods and services, such as transportation, food, and medical care. It is calculated by taking price changes for each item in the predetermined basket of goods and averaging them. Changes in the CPI are used to assess price changes associated with the cost of living.