
July 1, 2024
Market Update: June 21st, 2024
Welcome to the Monthly Market Update from Signature Wealth Management. I’m Brian Ransom, Research Director from Signature Wealth and here’s what happened in the market this month.
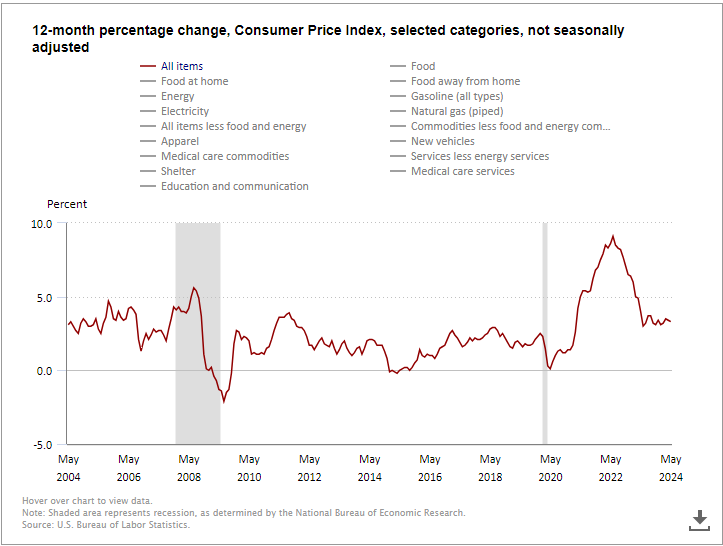
Let’s start off with a quick inflation update. We got some decent news on the inflation front this month. While the total CPI shown here in red looks like it’s still stuck in it’s sideways trend, the positive news is actually beneath the surface.
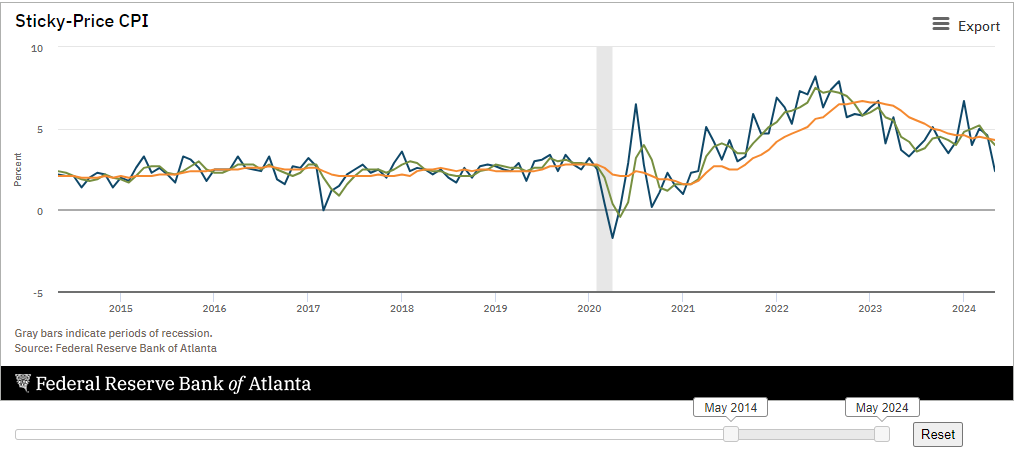
Sticky-price CPI shown here month-over-month here in blue, quarter-over-quarter in green, and year-over-year in orange, is showing a clear downward trend now. As a reminder, stick-price CPI tends to be a decent forecaster of long-term inflation so the fact that sticky-CPI is falling bodes well for future inflation, in my opinion.
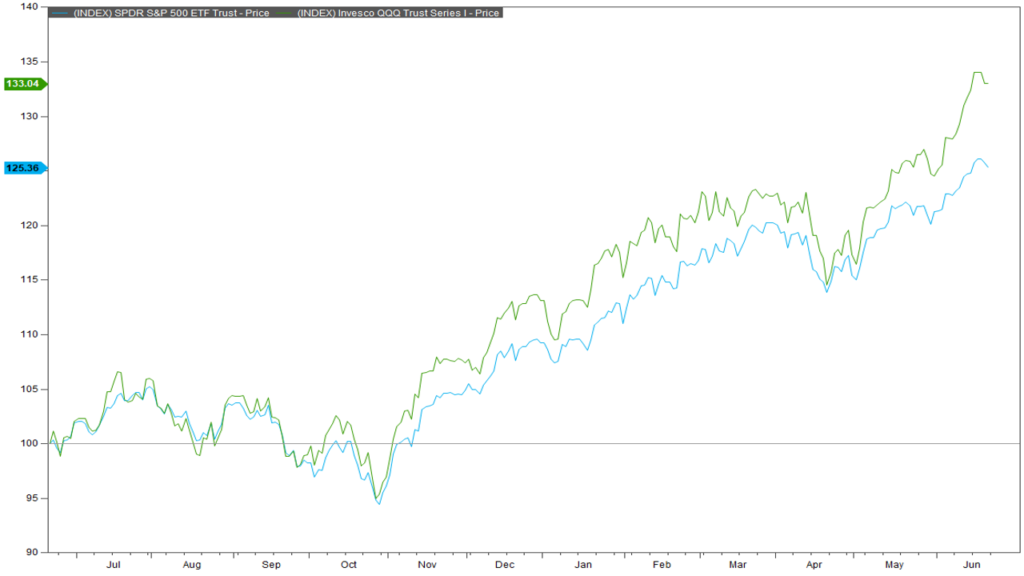
One interesting phenomenon seen in the market has been the heavy concentration of returns within the market itself. If an investor were to look at the strength of the S&P 500, shown in blue, and the Nasdaq 100, shown in green, that investor would think the market is perfectly health with strong returns throughout the index. But this assertion would be incorrect.
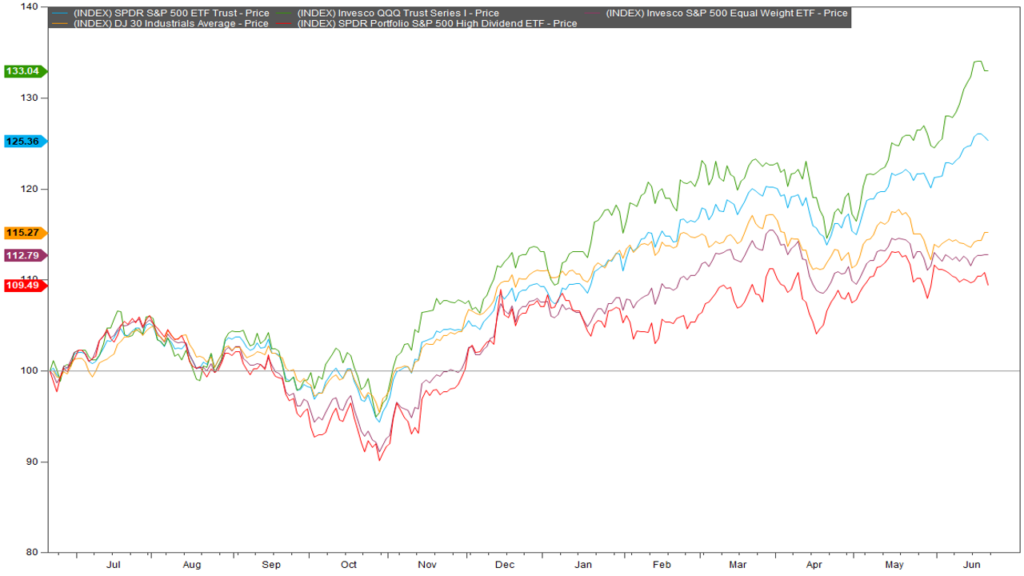
If you look at the same time period of returns but include the Dow Jones Industrial Average shown in orange, the equal weight S&P 500 shown in purple, and the high dividend index shown in red, you can see that the returns have essentially been flat all year. Because these three additional indices do not weight their allocations by the size of the company, returns aren’t concentrated in the largest stocks in the index. I.e. Nvidia, Amazon, Meta, Apple, or Microsoft. In fact, if you flash back a bit further to October 2023, you can see that all 5 indices move in conjunction with one another indicating that returns are broad-based and the market is healthy.
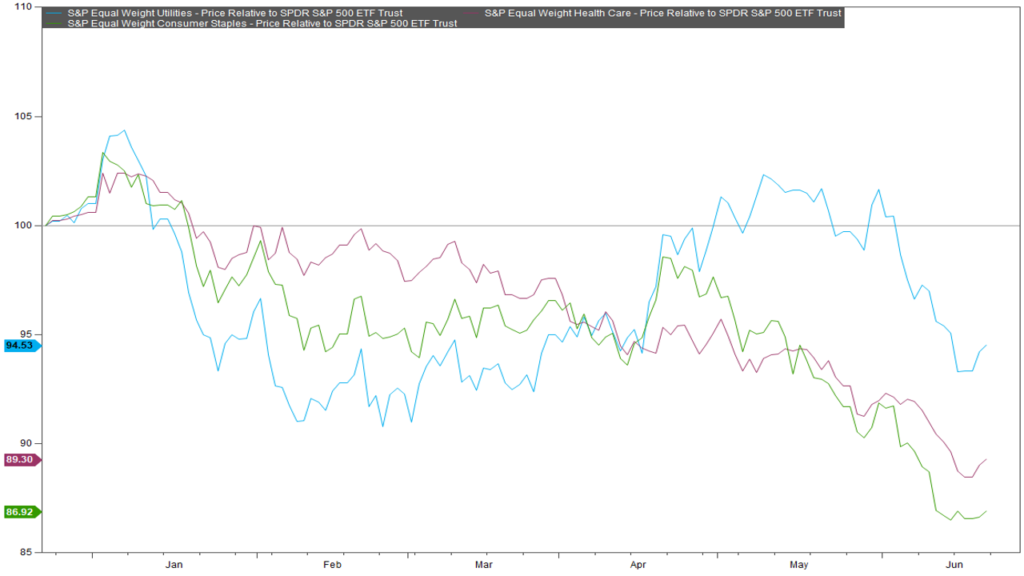
In fact, if you look at the individual sectors in the market, the “risk-on” sectors like consumer discretionary in blue, industrials in red, and financials in purple are all declining relative to the S&P 500, indicating at first glance that investors are very risk adverse right now. But that is not actually true because the “risk-off” sectors like utilities in blue, staples in green, and health care in purple are also declining relative to the S&P 500. The only sectors that are outperforming the S&P are tech and communications services i.e. Google, Netflix, and Meta.
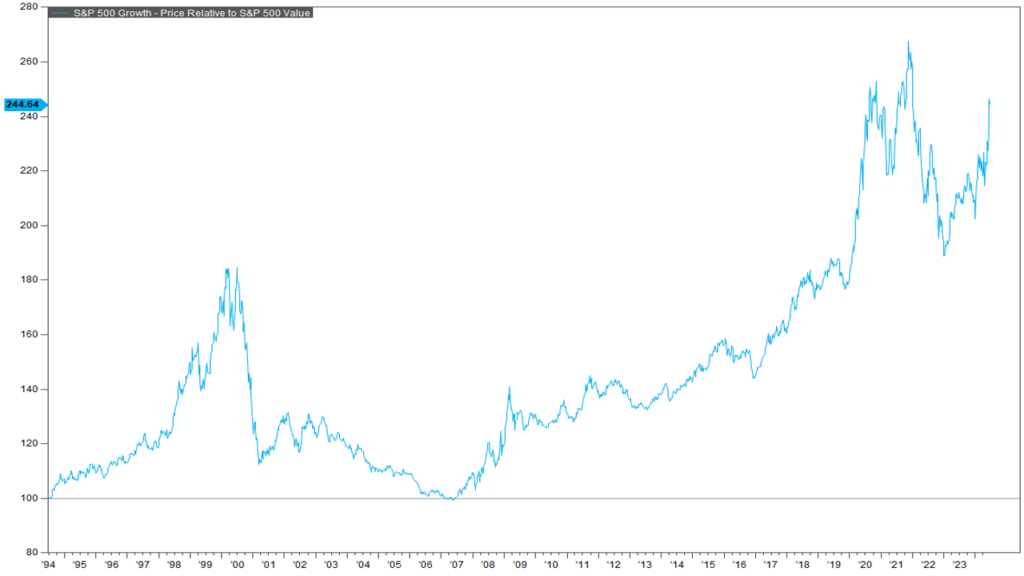
Trends like this usually don’t continue in perpetuity because the concentrated segments start to run out of buyers to boost the stock. Because investors are willing to continue to pile into a highly volatile index like the QQQ, there is clearly still an appetite for risk in the market and I think that bodes well for overall market performance. However, there is growing risk that the concentration in the popular indexes could result in underperformance in said indices. Typically growth does tend to outperform value over time as seen in this chart here. But when this chart goes vertical like in 1999 and 2020, there tends to be an equal but opposite reaction to the downside where value stocks outperform growth stocks. Because the major indices are so concentrated, a reversal of growth outperformance could spell trouble for index investors as this chart has gone vertical once again.
Thanks for joining for the monthly market update! We have a new podcast called “Business Tales.” You can find Business Tales on all your favorite podcasting apps. Also, our website is full of economic, financial planning, and market content. For those looking for more information please visit our website at signaturewmg.com. And don’t forget to like and subscribe.
1.Bureau of Labor Statistics. Consumer Price Index. “12-month percentage change chart, selected categories (past 20 years).” Updated June 12, 2024. Retrieved from https://www.bls.gov/cpi/
2.Federal Reserve Bank of Atlanta. Sticky-Price CPI. Updated June 12, 2024. Retrieved from https://www.atlantafed.org/research/inflationproject/stickyprice
3.FactSet Research Systems. (n.d.). S&P 500 and QQQ (interactive charts). Retrieved June 21, 2024, from FactSet Database.
4.FactSet Research Systems. (n.d.). S&P 500, QQQ, SPYD, Dow Jones Industrial 30, RSP (Interactive Charts). Retrieved June 21, 2024, from FactSet Database.
5.FactSet Research Systems. (n.d.). Equal weight Consumer Discretionary, Industrials, and Financials relative to S&P 500 (Interactive Charts). Retrieved June 21, 2024, from FactSet Database.
6.FactSet Research Systems. (n.d.). Equal weight Consumer Staples, Utilities, and Health Care relative to S&P 500 (Interactive Charts). Retrieved June 21, 2024, from FactSet Database.
7.FactSet Research Systems. (n.d.). S&P 500 Growth relative to S&P 500 Value (Interactive Charts). Retrieved June 21, 2024, from FactSet Database.
Signature Wealth Management Group is registered as an investment adviser with the SEC. Signature Wealth only transacts business in states where it is properly registered, or is excluded or exempted from registration requirements.
Information presented is believed to be factual and up-to-date, but we do not guarantee its accuracy and it should not be regarded as a complete analysis of the subjects discussed. All expressions of opinion reflect the judgment of the author as of the date of publication and are subject to change.
Information contained herein does not involve the rendering of personalized investment advice, but is limited to the dissemination of general information.
The Standard & Poor’s 500 (S&P 500) is an unmanaged group of securities considered to be representative of the stock market in general.
The Dow Jones Industrial Average provides a view f the US stock market and economy. Originally, the index was made up of 12 stocks, it now contains 30 component companies in various industries. See http://us.spindices.com/indexology/djia-and-sp-500?homepage=true for more information
Invesco S&P 500® Equal Weight ETF (RSP) is based on the S&P 500® Equal Weight Index (Index). The Fund will invest at least 90% of its total assets in securities that comprise the Index.
The SPDR® Portfolio S&P 500® High Dividend ETF seeks to provide investment results that, before fees and expenses, correspond generally to the total return performance of the S&P® 500 High Dividend Index (the “Index”). The Index is designed to measure the performance of the top 80 high dividend-yielding companies within the S&P 500 Index
Always consult an attorney or tax professional regarding your specific legal or tax situation.
Past performance does not guarantee future results. Consult your financial professional before making any investment decision.
Forward-looking statements are not guarantees, and they involve risks, uncertainties and assumptions. The use of words such as “will”, “may”, “could”, “should”, and “would”, as well as any other statement that necessarily depends on future events, are intended to identify forward-looking statements.
Information is not an offer to buy or sell, or a solicitation of any offer to buy or sell the securities mentioned herein.
The S&P U.S. Style Indices measure the performance of U.S. equities fully or partially categorized as either growth or value stocks, as determined by Style Scores for each security. The Style series is weighted by float-adjusted market capitalization (FMC), and the Pure Style index series is weighted by Style Score subject to the rules described in Index Construction.
All information presented prior to an index’s Launch Date is hypothetical (back-tested), not actual performance. The Index returns shown do not represent the results of actual trading of investable assets/securities. S&P Dow Jones Indices LLC maintains the Index and calculates the Index levels and performance shown or discussed, but does not manage actual assets. Please refer to the methodology paper for the Index, available at www.spdji.com for more details about the index, including the manner in which it is rebalanced, the timing of such rebalancing, criteria for additions and deletions, as well as all index calculations.
The Consumer Price Index (CPI) is a measure that examines the weighted average of prices of a basket of consumer goods and services, such as transportation, food, and medical care. It is calculated by taking price changes for each item in the predetermined basket of goods and averaging them. Changes in the CPI are used to assess price changes associated with the cost of living.
