May 28, 2024
Scary Tweet Right?

Scary tweet, right? This particular tweet from *checks notes* TicTocTick made news on May 7, 2024, caught over 82,000 views, received 526 likes, and was reposted 117 times. What’s really scary about this tweet is it’s not true. From the fact that yield curve didn’t exist in 1929 (not really, anyways) to the false implication that inversion length translates 1:1 to recession strength, this tweet packed in a lot of falsehoods in just a couple sentences. But it is believable enough to scare a lot of people into retweeting, making the post viral. Scary headlines are not a new tactic to drive web traffic, heck it’s basically the entire business model of the mass media. But it is a hustle nonetheless.
But let me dedicate the focus of this newsletter to the “long inversion = strong recession” myth from this tweet and then show why I’m not particularly worried about this inversion (at least not at this time).
The 1974 and 2008 inversions are mostly factual. In the weeks following the inversion, we saw a 48% and 55% drawdown for ’74 and ’08, respectively. Inversion of the 10-year minus 3-month treasury spread correctly preceded the last 4 recessions. 1974 and 2008 had particularly long inversion times and resulted in the two worst recessions since the Great Depression.
However, the length of a yield curve inversion is not predictive of the severity of a recession nor the corresponding market drawdown. As an example, the Dotcom bubble inversion lasted 143 days and had the same drawdown as the 1974 recession where the inversion lasted 337 days. 2020 had a much more severe drawn down than 1979 or 1981 and the curve was only inverted for 23 days. There is no relationship between the number of days a yield curve is inverted and the severity of a recession, as represented by the graph below.

Source: Factset Database, Interactive Charts.
*2022 not technically a recession
“Okay Brian, we get it. What about the inverted yield curve now?” There is always a chance of a recession and market pullback, as Covid taught us. But to get a recession, you typically need a combination of a banking liquidity crisis, industrial production slowdown, rising unemployment, excessively elevated asset pricing, or over-leverage with consumers, banks, or corporations.
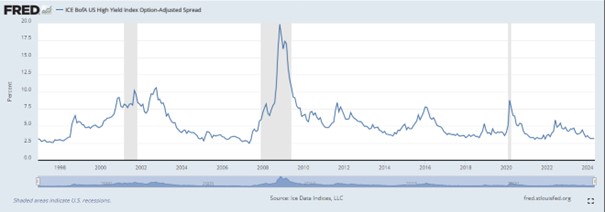
Investors can usually detect stress in those economic readings by looking at market reactions to assets like high yield bonds. When non-investment grade corporations issue bonds, they typically fetch higher yields because they are higher risk. When there’s forthcoming economic stress, these are the type of bonds that default and so they sell off, causing their spread to treasury bonds to spike. Spikes in high yield spreads typically precede recessions as seen prior to the Dotcom Bubble and prior to the Global Financial crisis, seen below indicated by the red arrows.

But over the last 2 years, high yield spreads have been falling (blue arrow). Meaning, that despite rising interest rates, rising inflation, and geopolitical tension, non-investment grade corporations are not seeing a lot of stress in their bonds. If there were stress or overleverage in the consumer, financial institutions, or corporations, these bonds would not be trading at record tight spreads. In other words, the market is implying that the likelihood of rising defaults in the junk bond market is very low. That’s not something you see prior to a recession.
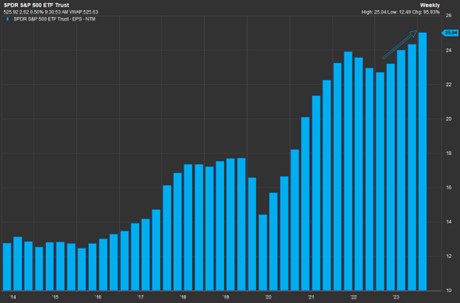
Furthermore, if there were economic distress, then earnings results wouldn’t be nearly as strong as they are currently. Most corporations have reported their 1Q2024 results which shows a 10% year-over-year growth rate. 10% earnings growth is not something you see under poor economic conditions. Let alone under economic conditions commiserate with 2008, 1974, or 1929.

Sources:
- FactSet Research Systems. (n.d.). S&P 500 (interactive charts). Retrieved May 15, 2024, from FactSet Database.
- Ice Data Indices, LLC, ICE BofA US High Yield Index Option-Adjusted Spread [BAMLH0A0HYM2], retrieved from FRED, Federal Reserve Bank of St. Louis; https://fred.stlouisfed.org/series/BAMLH0A0HYM2, May 20, 2024.
- FactSet Research Systems. (n.d.). S&P 500 Quarterly EPS (interactive charts). Retrieved May 15, 2024, from FactSet Database.
Brian Ransom, CFA®, MBA, MS
Research Director
Signature Wealth Management Group
This material is for informational or educational purposes only.
Investing involves risk including the potential loss of principal. No investment strategy can guarantee a profit or protect against loss in periods of declining values.
Diversification does not guarantee profit nor is it guaranteed to protect assets.
The Standard & Poor’s 500 (S&P 500) is an unmanaged group of securities considered to be representative of the stock market in general.
The 10-year Treasury Note represents debt owed by the United States Treasury to the public. Since the U.S. Government is seen as a risk-free borrower, investors use the 10-year Treasury Note as a benchmark for the long-term bond market.
Opinions expressed are subject to change without notice and are not intended as investment advice. Past performance does not guarantee future results.
