
October 30, 2023
The Debt Maturity Wall
The market movement over the last couple of months can really be summarized by one graph. In my humble opinion, this is the most important graph in all of finance right now and the market is just now starting to digest its implications. This is graph of the 10-year treasury bond yield that broke its multi-decade downward trading pattern back in 2022 and continues to rise here in 2023. Stocks and bonds, farms and businesses, homeowners and renters, credit card owners and issuers, student borrowers and universities, Congressmen and their constituents alike are all impacted by the changes made in the yield from this bond.
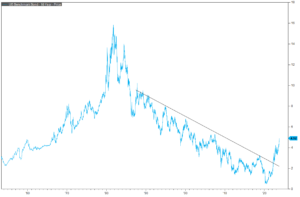
The reason why this yield is so important is because it reflects rising borrowing costs for all market participants. Gone are the days that businesses can borrow long term debt to fund capital projects at ultra-low rates. Coinbase issued BB- bonds in October 2021 for less than 4%, one month before the stock started a 91% peak-to-trough decline! We are now entering a new normal where everyone must factor in an impactful cost-of-capital.
The brunt of the impact over the last couple of months has firmly landed on the most indebted stocks in the S&P 500. In other words, the worst performing stocks since August have been the stocks with the highest debt load. The reason for this is simple: corporations will have a lot of debt coming due in 2025 and 2026 (a consequence of record debt issuance at low rates in 2020). That debt is very likely going to be reissued at higher interest rates at maturity. Especially in the high yield and leveraged loan space (light blue and grey).
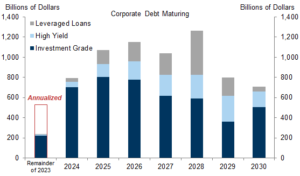
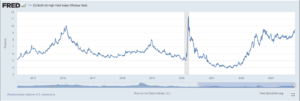
This has been deemed the “Debt Maturity Wall.” This is a problem for below-investment grade businesses who actively rely on the debt market to fund their business. Prior to 2022, the average high yield borrow could borrow at around 4%. Currently, the interest rate on high yield borrowers is around 9.5% which is much more expensive. And unlike 2020 or even 2016, this is not a cyclical spike in the interest rate but a new normal where high yield interest rates remain elevated for long periods of time.
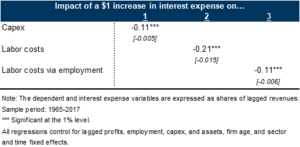
If a bond matures in 2025/26 and the borrow cannot payoff the debt bullet with operating cash flows, then those bonds will have to be reissued at higher rates. This Goldman study shows that in order to pay for the additional interest expenses, firms will cut back on both capital spending and labor costs. They show for every $1 increase in interest expense, we see an $.11 decrease in capital expenditures (Capex) and a $.21 decrease in labor costs. Thus, holding all other variables steady, we should see a measurable increase in unemployment, a decrease in wages, and a decrease in corporate capital spending directly caused by higher long-term interest rates.
Which means over the next year, assuming the 10-year yield remains elevated, unprofitable and highly levered firms will have to prepare for the possibility of interest expenses increasing over the next 5 years. To prepare for the maturity wall, Chief Financial Officers will be forced to cut back on spending. We’ve already seen Rite Aid declare bankruptcy and I’m sure others will follow along with increasing risk of default on high yield corporate debt and leveraged loans.
The good news is the actual economic damage from the debt wall should be limited. This is not the next Global Financial Crisis. Goldman estimates the higher interest expenses to reduce monthly payroll growth by about 5,000 jobs/month in 2024 and reduce GDP by .05%. Which really isn’t that big of a deal in the grand scheme of things. Furthermore, cash levels on the balance sheet in non-financial corporations are very high which should help cushion the blow.
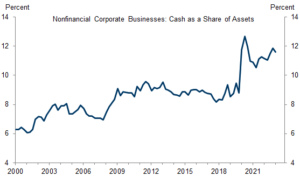
Ultimately, firms small and large will have to be much more targeted with capital spending due to the new normal which includes higher borrowing costs. Long term, this may actually be a good thing. Frugal spending with finite resource like cash typically translates into better long term returns for investors with fewer booms and busts. But short term, this is likely to have an impact on stocks and bonds going forward. Especially with firms that are on the more “levered” side of the spectrum. While it is very much a part of our investment process to avoid such over-levered firms, we are being particularly cautious in this investment environment.
Source:
- FactSet Research Systems. (n.d.). 10-Year Treasury Yield (Interactive Charts). Retrieved October 25, 2023, from FactSet Database.
- Goldman Sachs. US Economics Analyst. “The Corporate Debt Maturity Wall: Implications for Capex and Employment.” Published August 6, 2023. Retrieved from https://www.gspublishing.com/content/research/en/reports/2023/08/07/d2ab6cef-d9ea-453f-b4fa-912d22ab09ee.html.
- Ice Data Indices, LLC, ICE BofA US High Yield Index Effective Yield [BAMLH0A0HYM2EY], retrieved from FRED, Federal Reserve Bank of St. Louis; https://fred.stlouisfed.org/series/BAMLH0A0HYM2EY, October 24, 2023.
